
If you only looked at the headline numbers, the second quarter of 2026 looked almost too good to be true. In our Q3 2026 Quarterly Market Report, BIP Wealth's Chief Investment Officer, Eric Cramer, CFP®, CFA®, walked through what happened in the markets during Q2, why the rotation between growth and value keeps reversing itself, and why "sticking with the math" is the theme of the quarter.
Here's a summary of Eric's main talking points. You can also watch the full recording of the presentation below.
Shifting Sentiment
Source: MSCI, Bloomberg. For illustrative purposes only. Past performance is not a guarantee of future results. Returns are not reduced for any fees and do not represent actual portfolios.
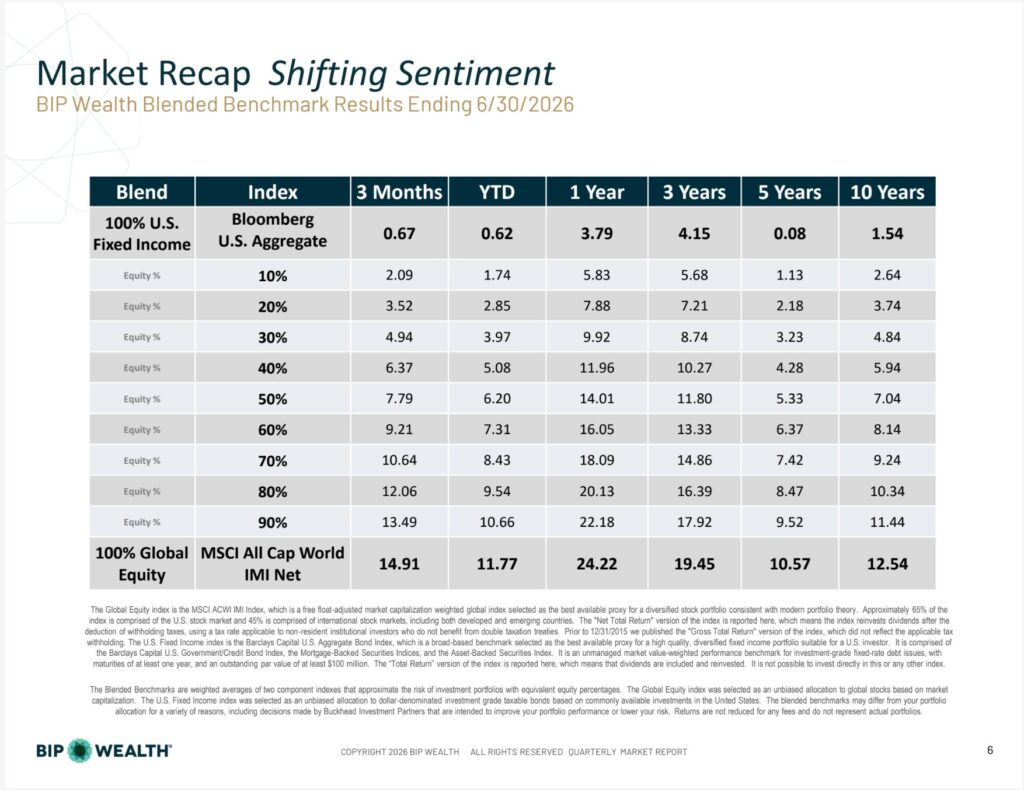
The MSCI All Cap World IMI Net Index, our proxy for global equities, returned 14.91% for the quarter and 24.22% over the trailing year. As Eric put it, that's nearly two years' worth of long-run returns compressed into three months.
Emerging markets led the pack, returning 24.05% for the quarter alone, ahead of U.S. stocks (15.43%), international developed markets (10.22%), and global real estate (10.76%). Fixed income, by contrast, barely moved: the Bloomberg U.S. Aggregate Bond Index returned just 0.67% for the quarter and 0.62% year-to-date.
That gap is a reminder of something Eric comes back to often: benchmark returns over long stretches never show the bad headlines along the way. The 1-, 3-, 5-, and 10-year numbers all look smooth and upward-sloping. It's only when you zoom into any single quarter that you see how much the ride actually moves around.
The Rotation Keeps Rotating
Source: Russell 3000, Russell 1000, Russell 2000 indices. For illustrative purposes only. Past performance is not a guarantee of future results. Indices are not available for direct investment.
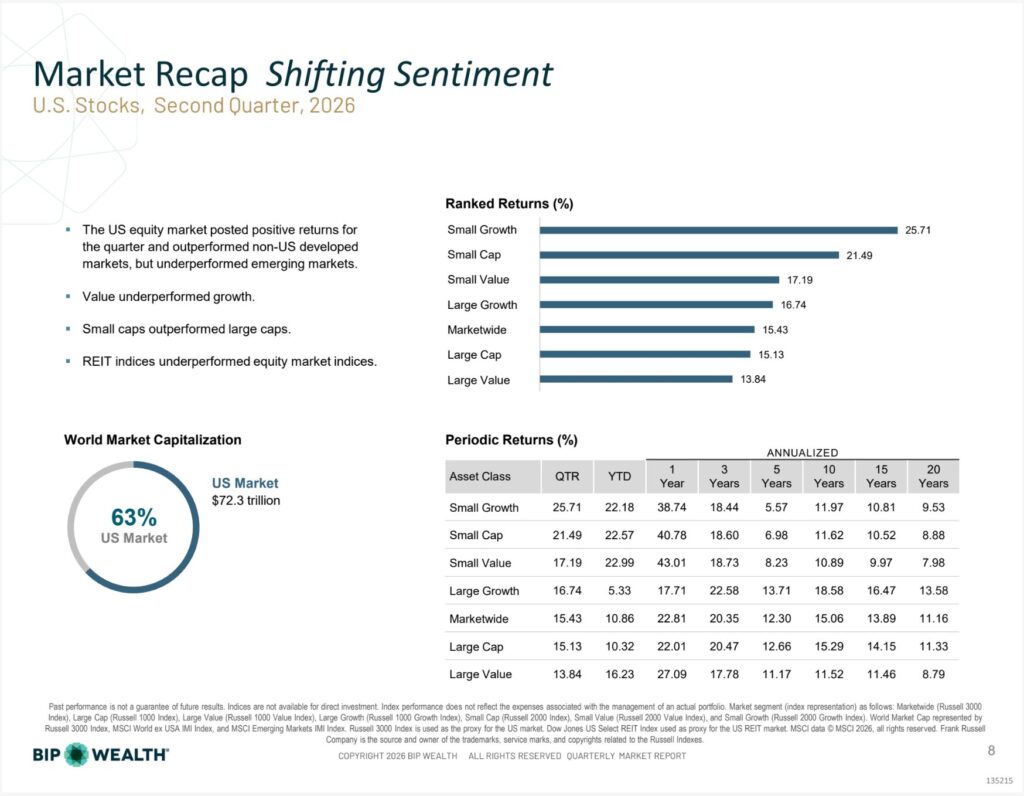
Within U.S. stocks, small caps and growth led the quarter. Small Growth returned 25.71%, Small Cap 21.49%, and Marketwide 15.43%. That's the opposite of what happened just one quarter earlier, when value led and growth lagged, and by Eric's account, the trend has already flipped again early in early Q3. Since the beginning of 2025, we've had these alternating quarters. Growth does better and it's the tech stock rally, and then tech stocks get punished.
"That's why BIP Wealth's data goes back decades rather than quarters. Zoom out to 10 or 20 years and small-cap value's edge over growth narrows or disappears depending on the window you choose—a good illustration of why chasing whichever style just won isn't a strategy."
International developed markets told a similar story: Growth led at 12.56% for the quarter versus Value's 8.15%. In emerging markets, growth also outpaced value for the quarter, though value has meaningfully outperformed growth over the trailing 5-year period. Pick your time frame, and the same data can tell a different story.
Source: MSCI All Country World IMI Index; Russell 3000 Index (U.S. proxy). For illustrative purposes only. Past performance is not a guarantee of future results.
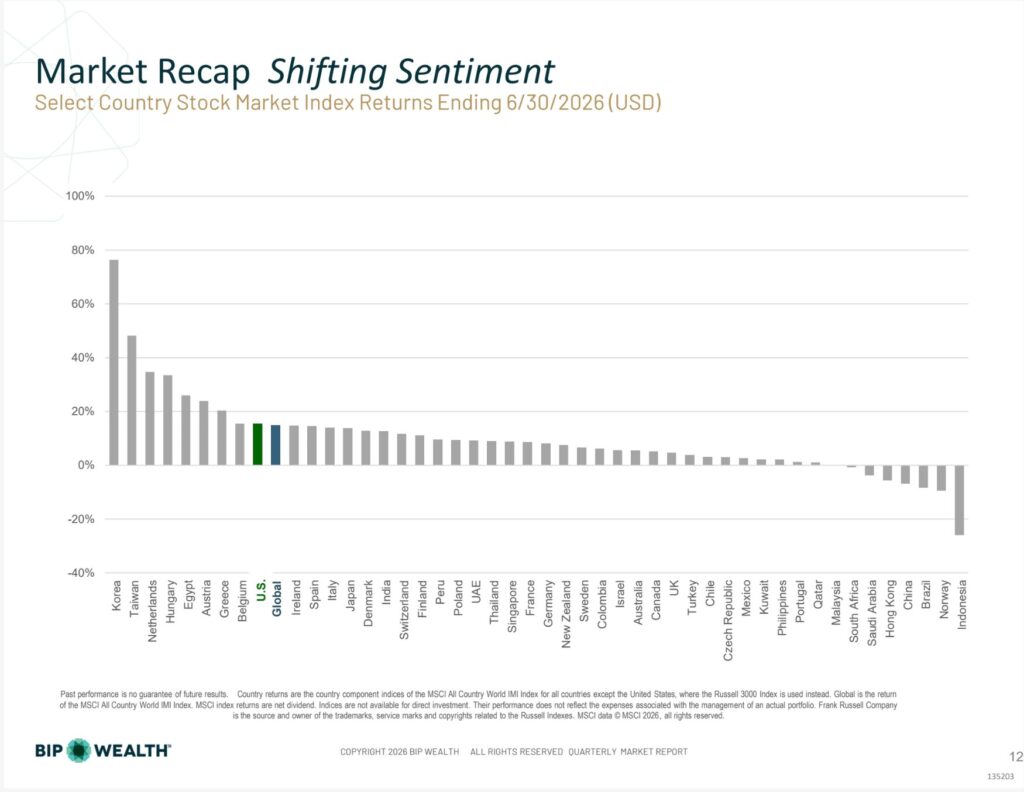
Country-level dispersion was extreme. Korea led all major markets with a roughly 76% one-year return, driven substantially by semiconductor exposure, even as, in Eric's words, that same sector has recently started "getting destroyed" as AI-infrastructure valuations wobble. The U.S. and global benchmarks landed in the middle of the pack, both right around 14 to 15%, while a handful of markets, including Indonesia and Brazil, posted negative returns for the period.
Fixed Income: Rates Ticked Up, Public Bonds Stayed Modest
Source: Bloomberg, Federal Reserve, S&P, and ICE BofA index data. For illustrative purposes only. Past performance is not a guarantee of future results. Indices are not available for direct investment.
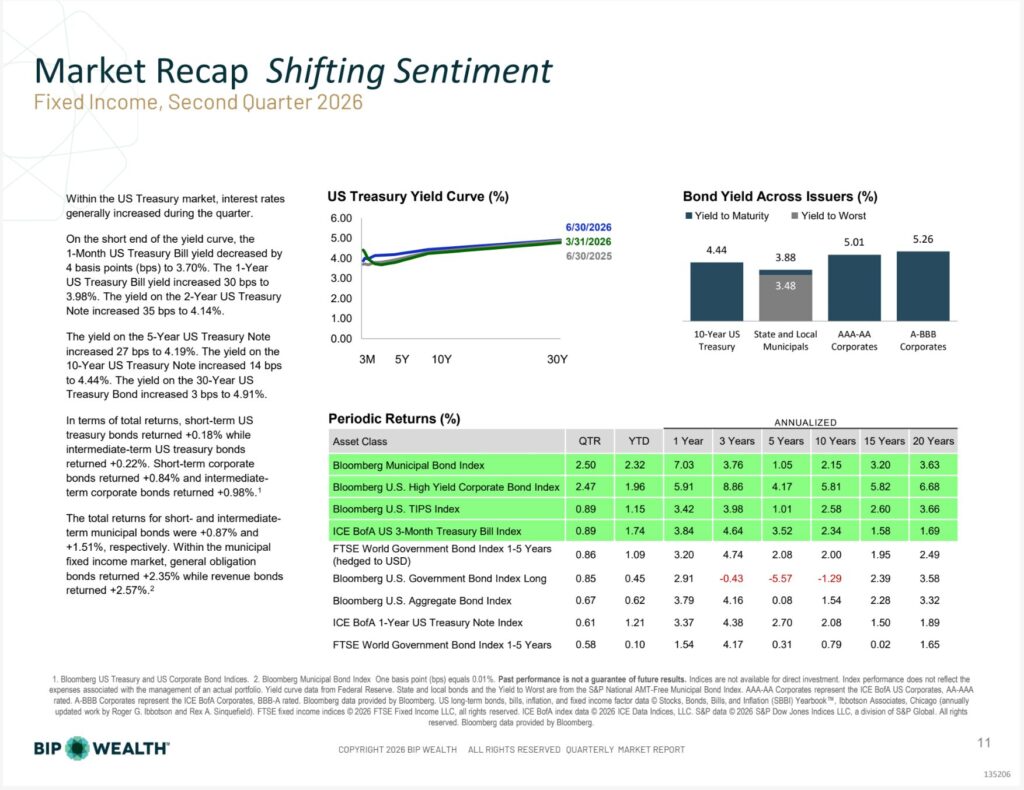
Yields rose across most of the Treasury curve during the quarter. The 10-Year Treasury yield climbed to 4.44%, and the 30-Year moved to 4.91%. Because bond prices move inversely to yields, that pressured returns on longer-duration bonds even as income kept accruing.
Eric's larger point is that the public fixed income in most portfolios, the ETFs and mutual funds clients typically see, is intentionally conservative. BIP Wealth tends to keep interest-rate and credit risk modest in that public bucket, and looks instead to private markets for fixed income exposure meant to generate more meaningful return.
Stick With the Math
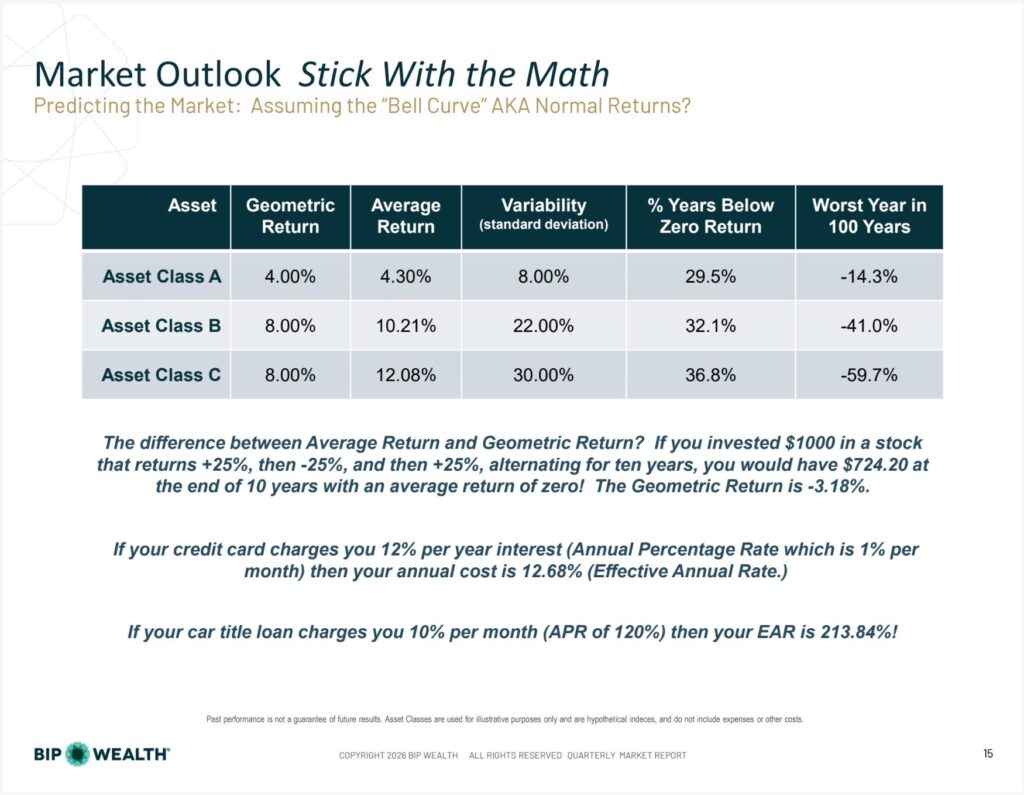
Source: Illustrative hypothetical indices. Past performance is not a guarantee of future results. Asset Classes are used for illustrative purposes only and do not include expenses or other costs.
This quarter's Market Outlook title came from a simple idea: predicting the future requires making assumptions, and those assumptions matter enormously, even though almost nobody ever asks to see them.
Eric walked through a few of the building blocks that go into BIP Wealth's financial planning models:
Average return isn't the same as geometric (compounded) return. If a hypothetical $1,000 investment goes up 25%, down 25%, up 25%, down 25%, and up 25% over five swings, the average return is exactly zero, but the ending balance would be $724.20, a geometric return of roughly -3.18% per year. The more volatile an investment is, the bigger that gap gets. It's the same math that explains why a credit card's 12% APR actually costs 12.68% once monthly compounding is factored in, and why a 10%-per-month car title loan, at a 120% APR, has an effective annual rate of 213.84%.
Variability cuts both ways. A safer, lower-return asset class and a higher-return, more volatile one can have a similar share of down years, but the size of the bad years is dramatically different. That's the trade-off investors make every time they choose how much risk to take.
Correlation is what makes diversification work. Two asset classes that move in perfect lockstep don't provide any real diversification benefit. The value of combining, say, U.S. and international stocks comes from the fact that they don't move exactly together, even though both are expected to be productive over time.
Predicting Your Future: Life Is Complicated
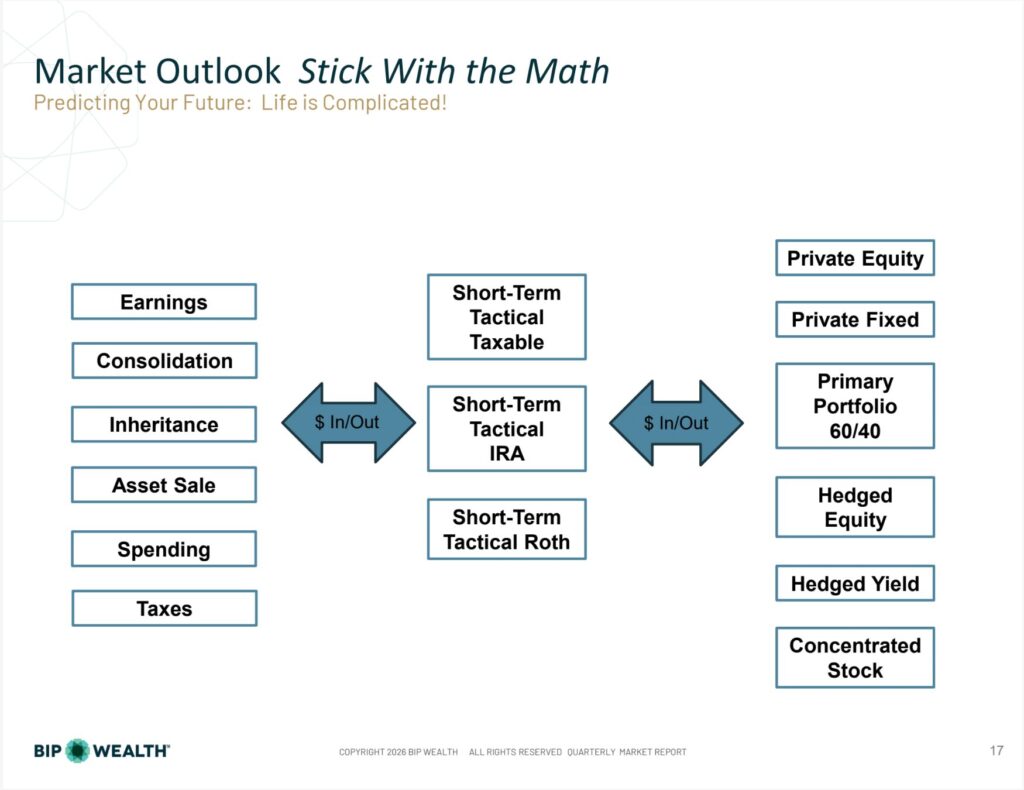
The second half of Eric's presentation shifted from markets to the other half of every financial plan: you.
"Real financial plans aren't a single lump sum growing quietly in the background. Money flows in from earnings, inheritances, and asset sales, and flows out through spending, taxes, and major purchases, often across a half-dozen different account types and strategies at once. Modeling that accurately, and adjusting it as life changes, is where much of the real planning work happens."
A few of the specific opportunities Eric highlighted:
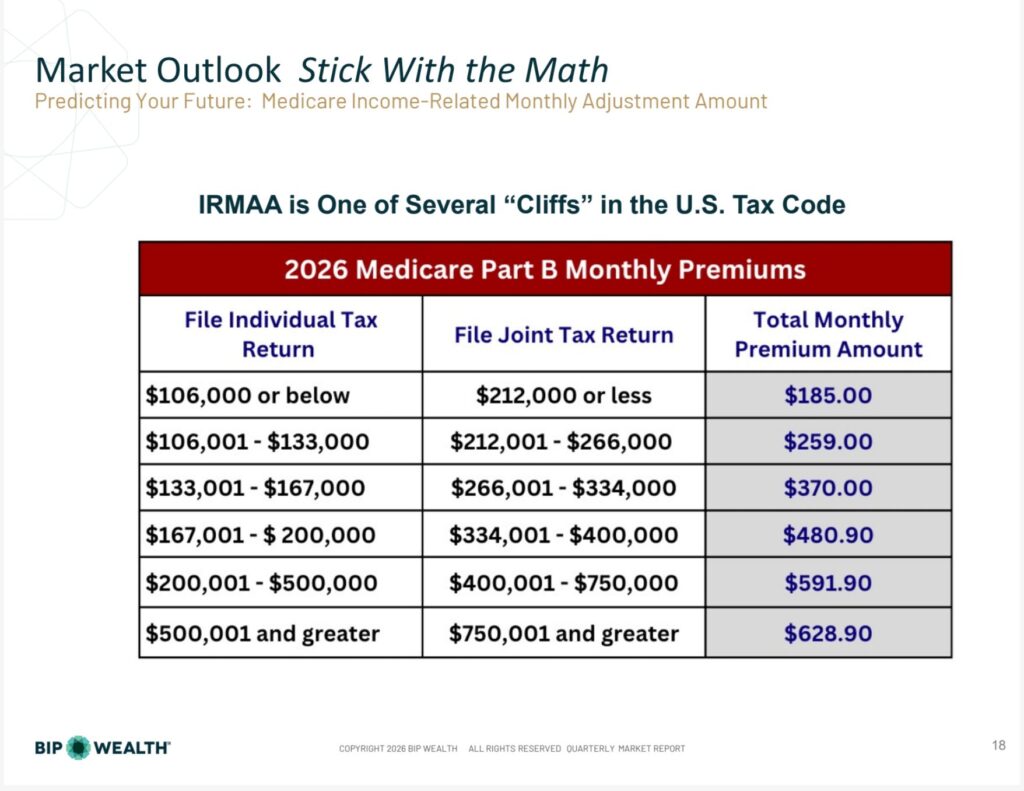
IRMAA is a cliff, not a ramp. Medicare's Income-Related Monthly Adjustment Amount jumps in discrete steps based on income. Cross a threshold by even a dollar, and the monthly premium adjustment jumps with it. That makes year-end income timing decisions, like when to realize gains, genuinely worth planning around.
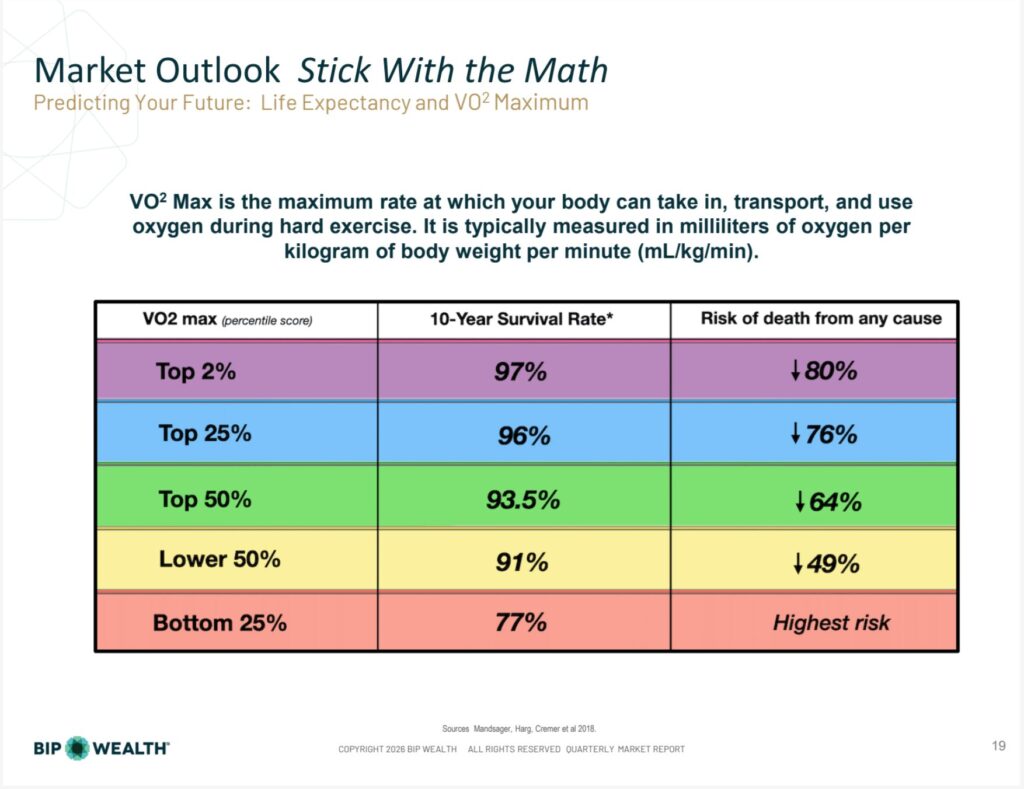
Source: Mandsager, Harg, Cremer et al. 2018.
Fitness level is a meaningful predictor in a financial plan. VO2 max, a measure of how efficiently the body uses oxygen during hard exercise, is one of the strongest predictors of life expectancy available. In the study Eric cited, people in the top 2% for VO2 max had a 97% ten-year survival rate, compared with 77% for the bottom 25%, and a roughly 80% lower risk of death from any cause relative to the lowest-performing group.
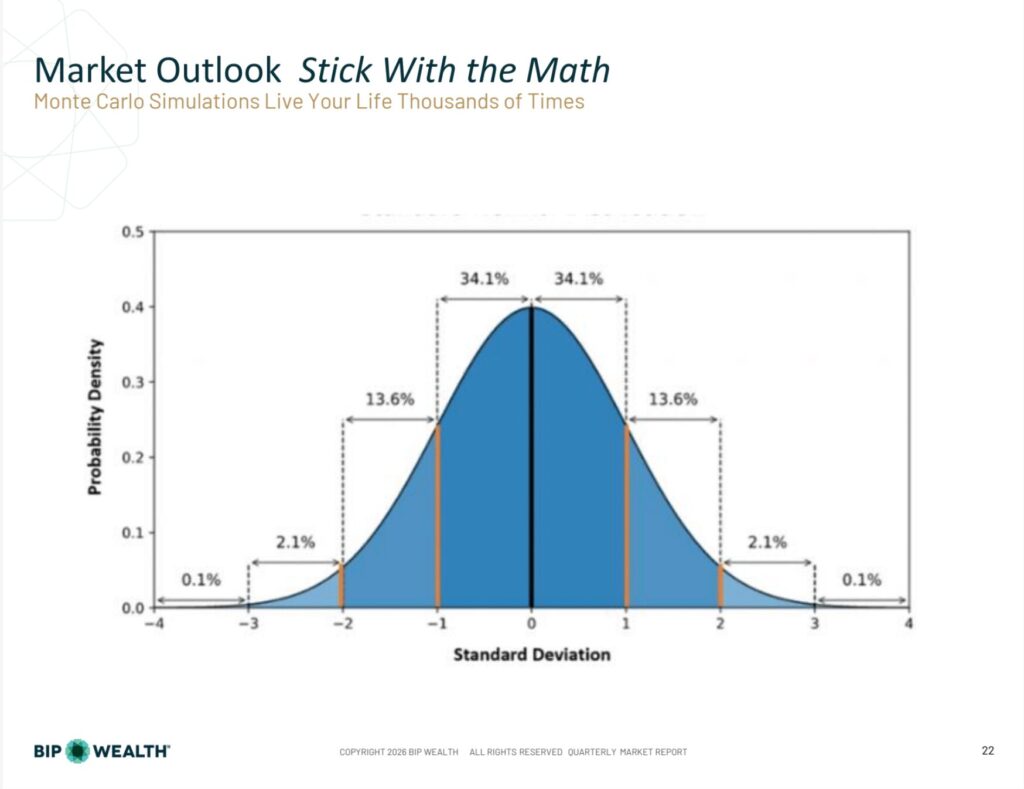
Monte Carlo simulation is how BIP Wealth turns assumptions into a probability. Rather than assuming a fixed average return, the planning software effectively lives out a client's full financial life thousands of times, varying market returns, life expectancy, spending, and other inputs each time, then counts how often the plan succeeds. Eric likens it to reliability engineering, the discipline behind testing how spacecraft and aircraft hold up under stress: a "95% chance of success" on a financial plan means it holds up in all but the least likely, worst-case outcomes. For context, Eric noted that the space shuttle program's own reliability engineering put the odds of a flight without a major incident at roughly one in 35, a reminder that even a plan built to a lower success rate than most people expect can still reflect a carefully engineered level of risk.
Final Thoughts
Eric's closing message echoed the same discipline BIP Wealth has emphasized all year. As he put it, "the markets, the stock market, are just one element of that math equation." Life expectancy, spending goals, tax rules, and personal priorities around what clients want to leave behind all shape a plan as much as expected returns do, and two clients with identical portfolios can end up with dramatically different plans once those personal variables are factored in.
"Doing the math on your specific situation is critical."
Our team's approach to evidence-based investing means continually re-examining assumptions rather than assuming the future will look exactly like the past. Our core message for investors hasn't changed: stay diversified, keep your financial plan current, and let the math, not the headlines, guide the decisions.
If you have questions about how any of this applies to your situation, reach out to connect with a BIP Personal Wealth advisor.
This blog is provided for informational purposes only. Specific investments may not be suitable for all investors and no offer or recommendation of any investment or investing strategy is intended or implied by your choosing to read this blog. Past performance is no guarantee of future results. All investments involve risks including loss of principal.
This material is not intended to be relied upon as a forecast or investment advice regarding a particular investment or the markets in general, nor is it intended to predict or depict the performance of any investment. The opinions in this commentary are as of a specific date and are subject to change. Information has been obtained from third-party sources we consider reliable, but we do not guarantee the facts cited are accurate or complete. .
BIP Wealth, LLC (“BIP Wealth”) offers investment advisory services and is registered with the U.S. Securities and Exchange Commission (“SEC”). Registration with the SEC as a registered investment adviser does not imply a certain level of skill or training. For more information about BIP Wealth, please refer to our Form ADV, available at adviserinfo.sec.gov or upon request.