If you’ve been following the financial headlines lately, you’ve probably heard the word “stagflation” more than once. It’s a term that means something very specific—and something most investors haven’t had to seriously contend with for four decades. In our Q2 2026 Quarterly Market Report webinar, BIP Wealth’s Chief Investment Officer, Eric Cramer, CFP®, CFA®, walked through what happened in markets during the first quarter, where he thinks inflation and economic growth are headed, and why now is exactly the right time to stay disciplined.
Here’s a summary of Eric’s main talking points for this quarter. You can also watch the full recording of the webinar below.
The Top U.S. Stocks Got Hobbled—Again
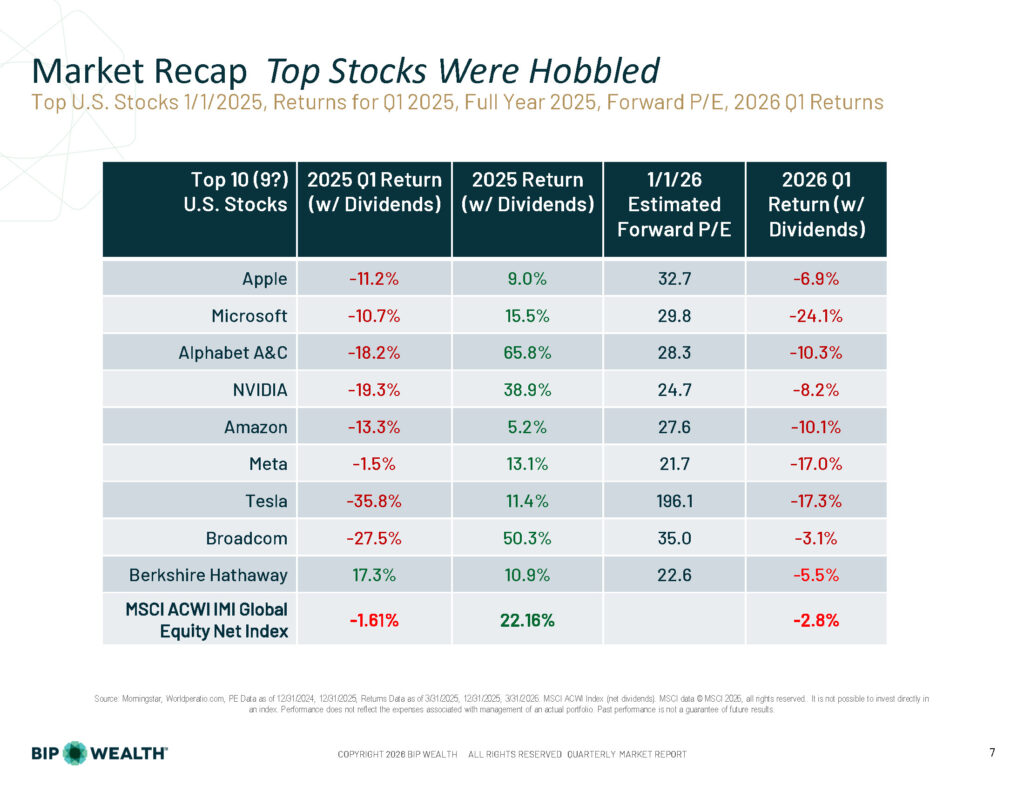
What happened in 2025 is turning out to be the template for what’s happening in 2026. High valuations with these top 10 stocks, big sell-off in the first quarter, and then a rally to begin to bring most of these back.
Source: Morningstar, Worldperatio.com. PE Data as of 12/31/2025, Returns as of 3/31/2026. For illustrative purposes only. Past performance is not a guarantee of future results.
If you followed our Annual Market Report earlier this year, this story will feel familiar. The top 10 U.S. stocks—companies like Apple, Microsoft, NVIDIA, and Meta—now represent roughly 40% of the total U.S. market. They entered 2026 with elevated valuations, and in Q1 they paid for it: nearly every name on that list posted significant negative returns, some by double digits.
The good news? Just like in 2025, these stocks have largely started to recover as Q2 has unfolded. The pattern is holding: high valuations, a Q1 selloff, then a rebound. That doesn’t mean Eric is comfortable with those valuations, it just means staying diversified and staying invested has, once again, been the right call.
For the broader market, the MSCI ACWI IMI Global Equity Net Index was down 2.75% in Q1. Fixed income was essentially flat. If you’re diversified across asset classes and geographies, you likely weathered the quarter without much drama.
Value Led. Emerging Markets Led. The U.S. Trailed.
Source: Russell/MSCI. For illustrative purposes only. Past performance is not a guarantee of future results. Indices are not available for direct investment.
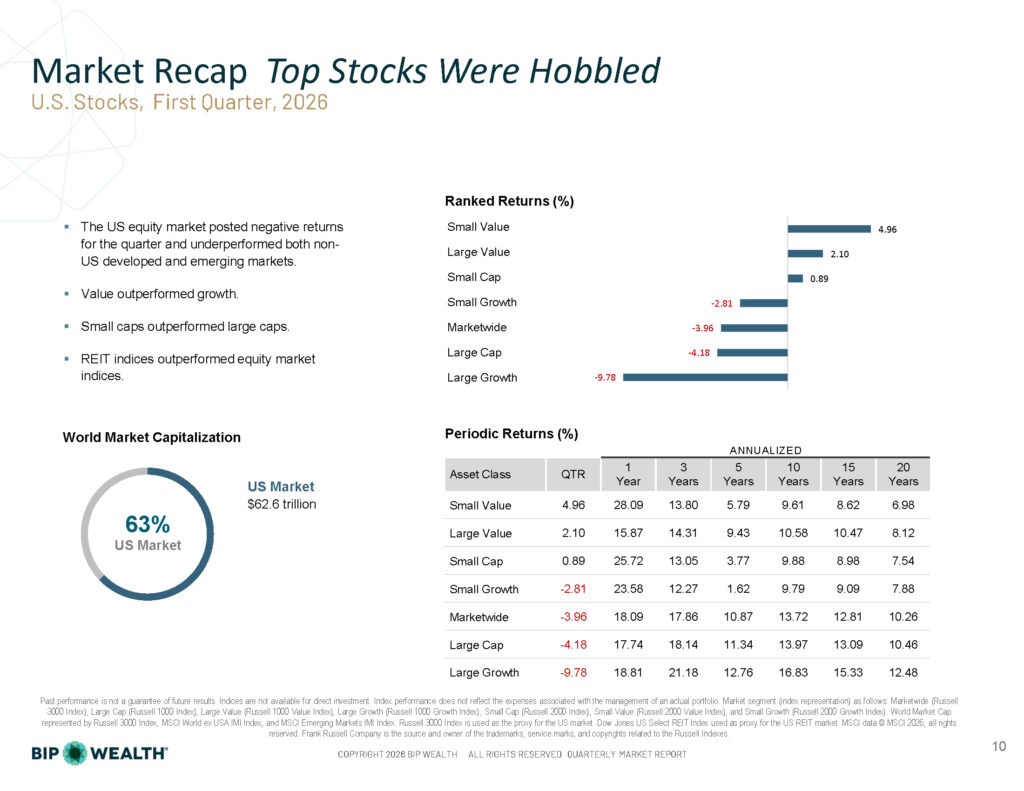
This quarter confirmed a trend we’ve been tracking for several quarters now: the U.S. has not been the best place to invest. That’s not a permanent indictment—we still maintain a modest U.S. overweight, as most advisors do—but the data keeps pointing in the same direction.
Within the U.S., value outperformed growth and small caps outperformed large caps. These are results broadly consistent with what long-term historical data would predict. Small Value returned +4.96% for the quarter while Large Growth fell -9.78%. This is exactly what we’d expect when the high-flying, high-valuation names run out of momentum.
Overseas, the story was similar. International developed markets declined modestly in USD terms but still outperformed the U.S. Emerging markets, despite posting slightly negative Q1 returns, and have had a standout trailing year. As mentioned in a previous blog from Eric, Emerging markets have quietly continued to lead the recovery in Q2 so far.
The Yield Curve Is Looking Relatively Normal
Source: Federal Reserve. For illustrative purposes only.
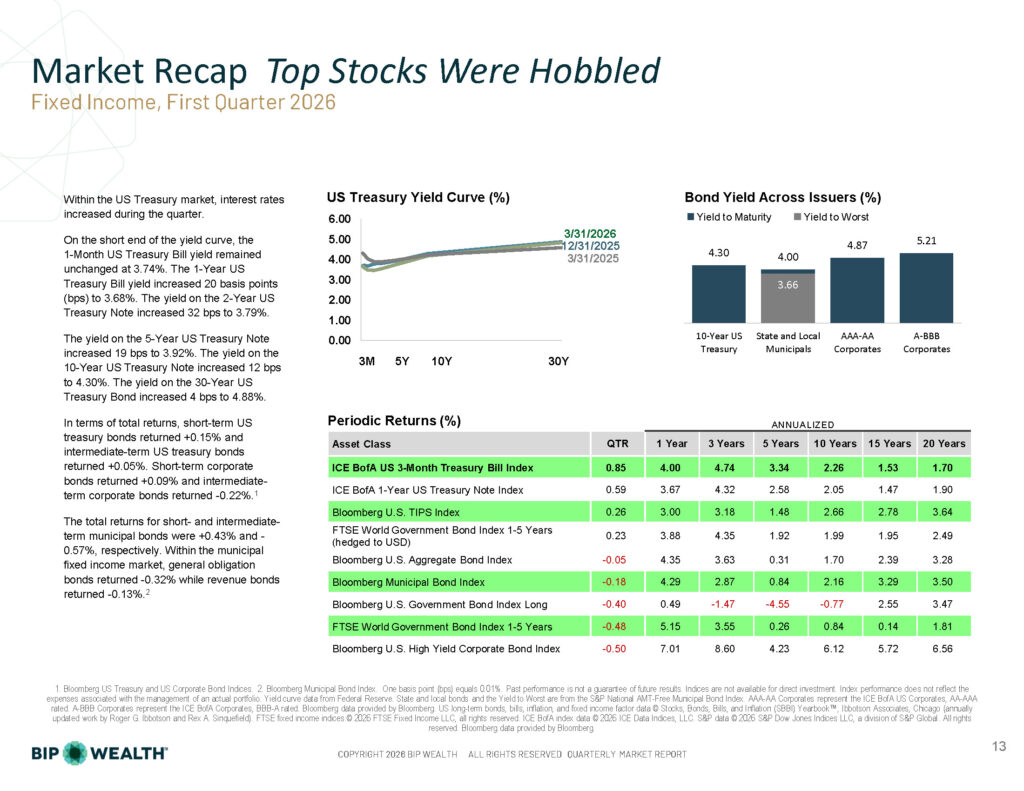
One thing Eric pointed out that doesn’t always get attention: the yield curve is looking reasonably normal right now. Short-term rates are lower than long-term rates, which is exactly how it’s supposed to work. When we see severe distortions on the short end of the curve, it usually signals the Fed is either too aggressive or too loose. Right now, the market seems to believe the Fed’s posture is appropriate.
That said, rates did tick up across most maturities during the quarter: the 10-Year Treasury yield moved to 4.30%, and the 30-Year to 4.88%. For clients near or in retirement who rely on fixed income, the one-year return on the Bloomberg U.S. Aggregate of 4.35% is reasonable. But to be clear, over a 10- or 20-year horizon, the real risk is being too conservative. Equities have historically delivered meaningful premiums over fixed income over long periods, and that relationship held again over every multi-year period shown in our blended benchmark data.
So, Is Stagflation Coming?
This is the big question. Eric doesn’t know the answer yet, and he’s not convinced anyone else does either. But it’s important to understand what we’re watching and why it matters.
Stagflation occurs when economic growth slows at the same time inflation rises. It’s a particularly painful combination because the normal policy tools work against each other—cutting rates to spur growth can make inflation worse; raising rates to fight inflation can suppress growth further. We saw it in the 1970s and early 1980s, and it was rough.
Here’s what concerns Eric right now:
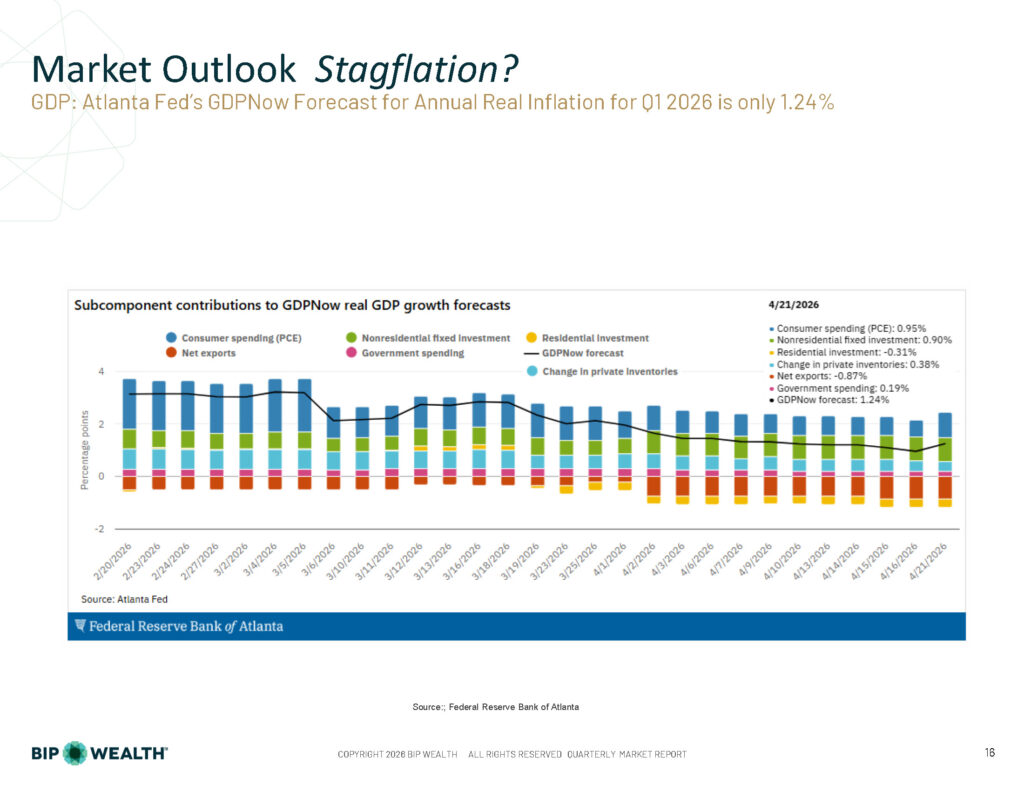
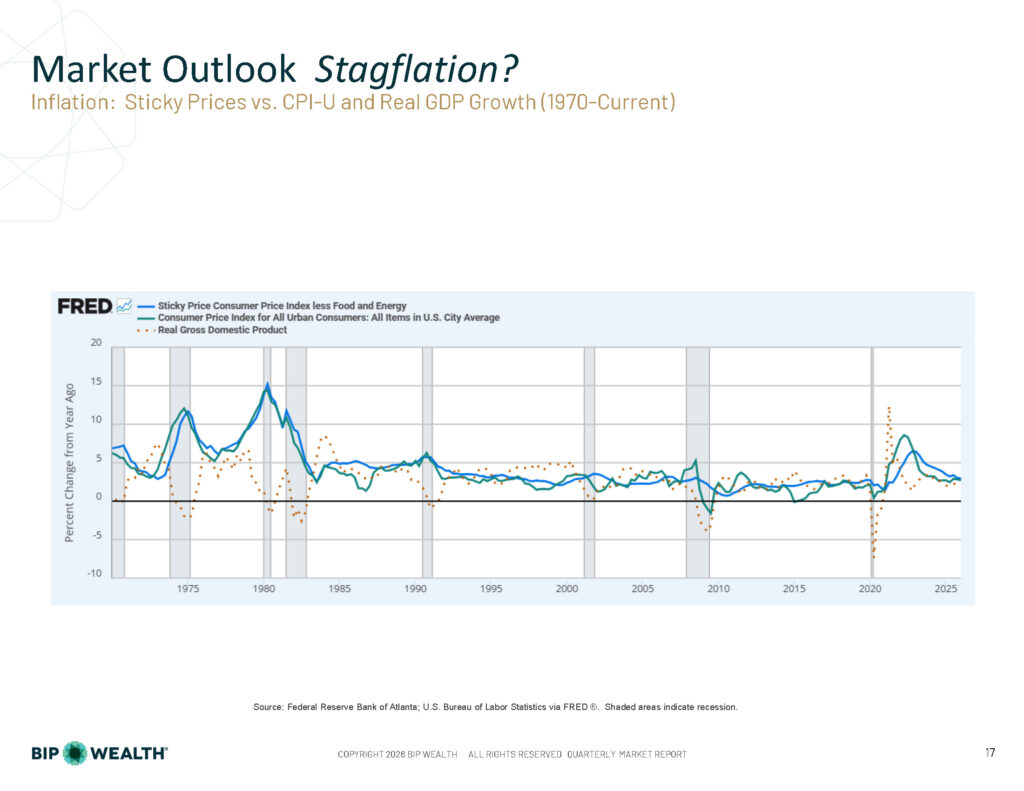
Economic growth may be softening. The Atlanta Fed’s GDPNow model was forecasting just 1.24% real GDP growth for Q1 as of late April (though that number has since climbed back toward 3.5%, a reminder of how volatile real-time forecasts are). Reliable GDP data is always a year behind by the time it’s been revised; we’re navigating with incomplete maps.
Source: Federal Reserve Bank of Atlanta. For illustrative purposes only.
Inflation may be picking up. CPI data has become less reliable than it used to be: survey response rates are down, and some government data collection has been underfunded. But the trajectory appears to be moving higher. If we look at the historical record going back to 1970, virtually every major inflation spike has been followed by a recession. The one exception in recent memory was post-COVID, and we were right at the time to say we didn’t think a recession was coming. We were right then. Whether that holds again is less certain.
“If you start to see inflation spike in the near term, most of the time that means we’re going to have a recession. So we’re certainly watching out for it.”
Source: Federal Reserve Bank of Atlanta; U.S. Bureau of Labor Statistics via FRED®. Shaded areas indicate recessions.
Commodity Prices Are Sending a Warning
Source: Bloomberg Commodity Total Return Index. For illustrative purposes only. Past performance is not a guarantee of future results.
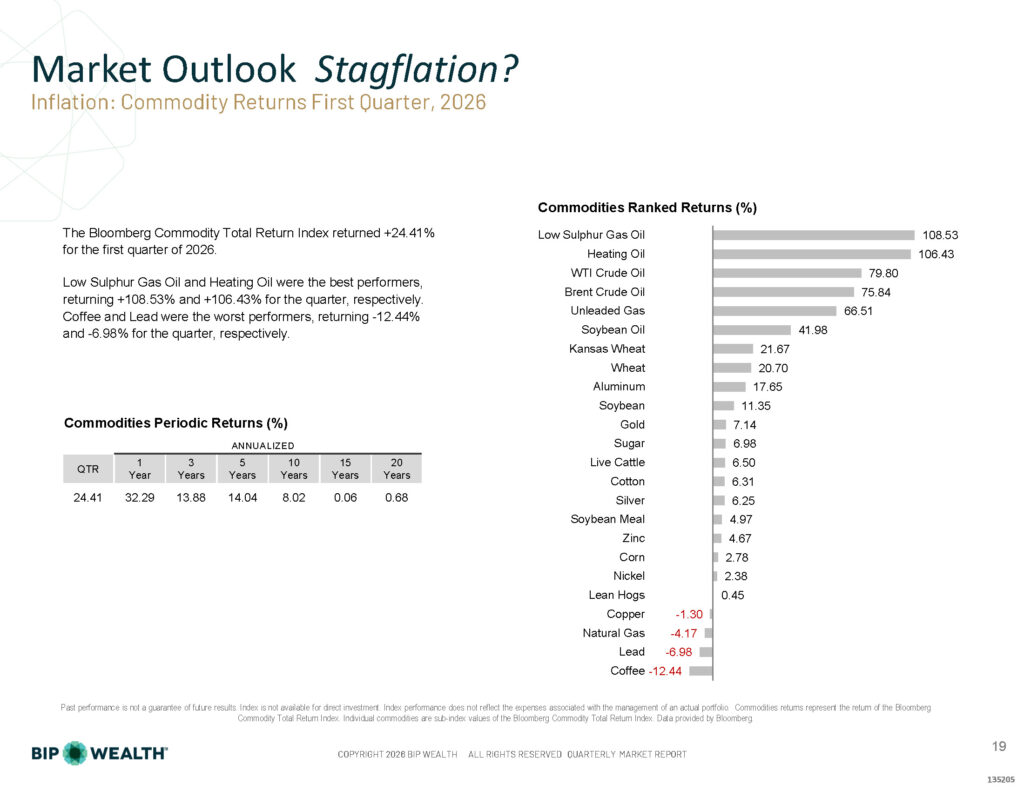
The Bloomberg Commodity Total Return Index returned +24.41% in Q1 2026. That number alone should get your attention. Energy led the way with Low Sulphur Gas Oil and Heating Oil each roughly doubled in the quarter. Crude oil was not far behind.
One nuance worth calling out: the spot price of oil and the futures price are not the same thing, and much of what gets reported in financial media reflects futures prices. At the beginning of April, the Europe Brent spot price hit around $127 per barrel—roughly $30 higher than futures at the time. Some refineries around the world were paying $150–175 per barrel in isolated transactions on the spot market. That difference matters; it’s what actually hits consumers and businesses in the short term.
Add to that the fact that the Strait of Hormuz disruptions continue to affect supply chains, and you have a recipe for continued inflationary pressure in the quarters ahead.
Global Trade Power Is Shifting and the U.S. May Be on the Outside
One of our four key themes for 2026 is “Shifting Global Trade Power,” and Q1 gave us more evidence that this trend is accelerating.
Sources: Reuters, Baker Institute.
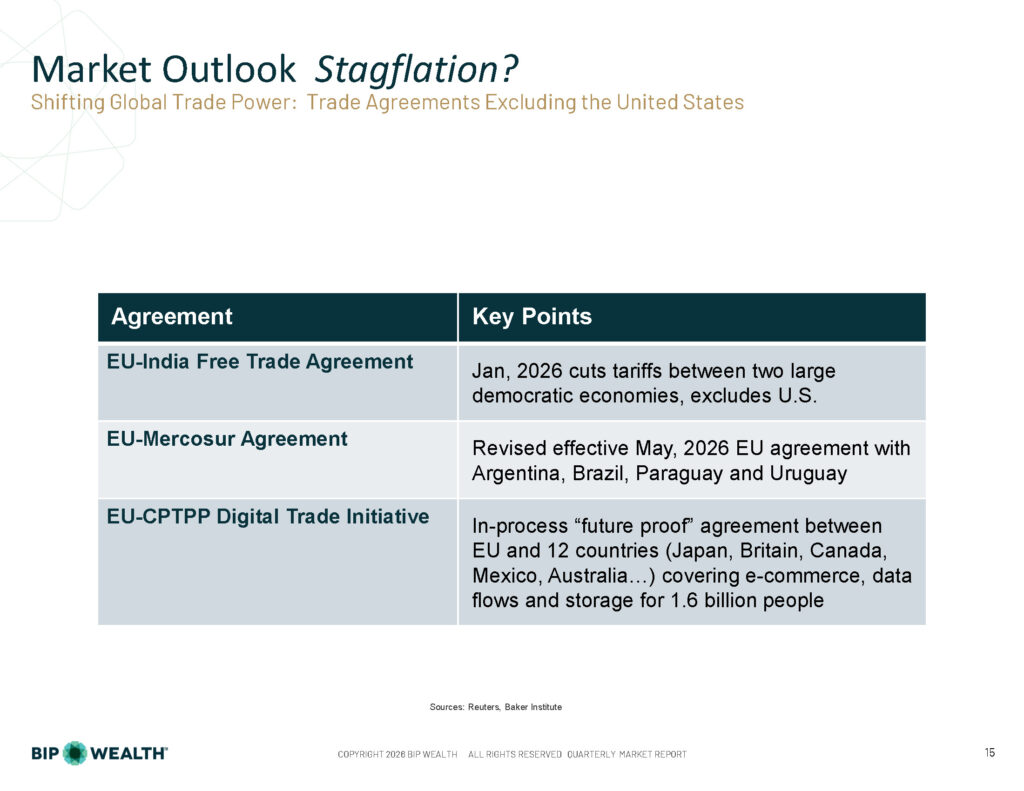
Three significant trade agreements—the EU-India Free Trade Agreement, the revised EU-Mercosur Agreement, and the in-progress EU-CPTPP Digital Trade Initiative—are all designed to chart a course that doesn’t depend on U.S. participation. I remember watching something similar happen after COVID, when global companies scrambled to reduce their reliance on Chinese supply chains. What we’re seeing now is a version of that, but applied to U.S. economic policy uncertainty.
All parties are making moves to protect what they perceive is in their own best interests. And the net effect of that could be that the United States is just becoming more and more isolated.
“This isn’t necessarily a catastrophe. But it does mean the environment is changing, and investors should expect the data to look different going forward: more volatility in the dollar, more pressure on trade-sensitive sectors, and potentially lower long-run U.S. growth relative to international markets.”
History Has Rewarded the Patient Investor
Source: Dimensional Fund Advisors. Past performance is not a guarantee of future results. Index is not available for direct investment.
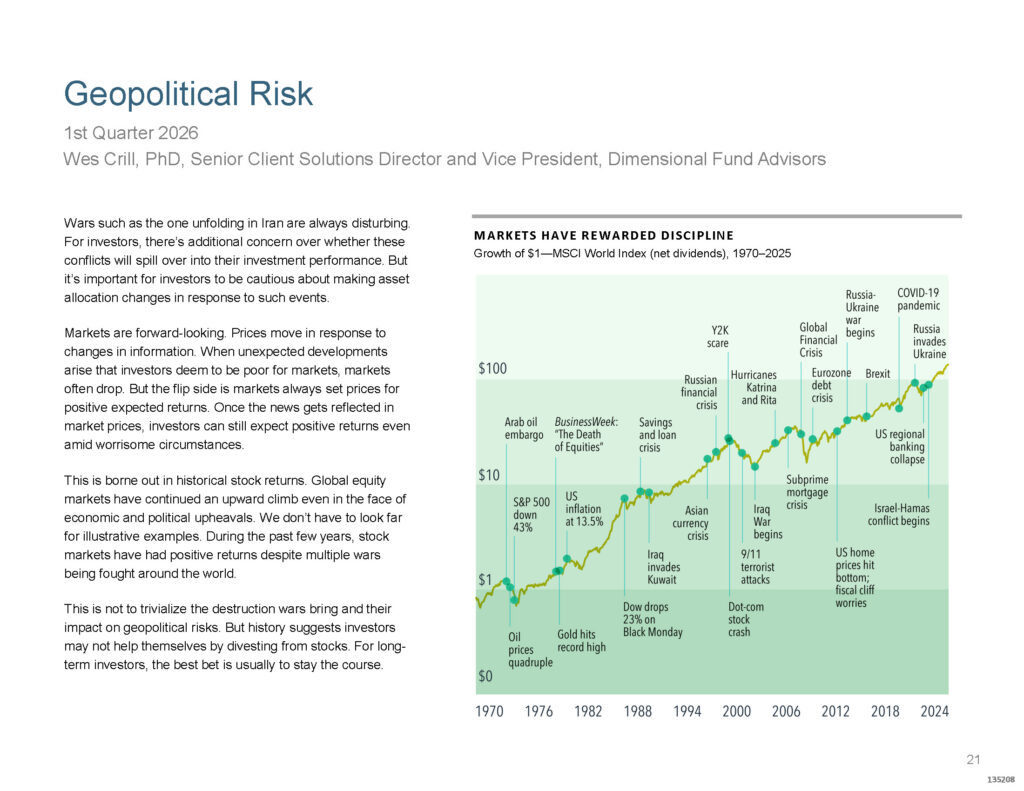
Eric closed with something worth repeating: current events always feel unsettling when you’re living through them. The Arab oil embargo. Black Monday. 9/11. The Global Financial Crisis. COVID. In every one of those moments, there were credible arguments for why this time was different, why capitalism was broken, why markets would never recover.
They were wrong. Every time.
“Sometimes it’s like standing on the edge of a cliff, waiting for a gust of wind that might blow you over. That’s kind of a normal thing. But democracy, capitalism, property rights, rule of law, and just the innovative spirit of millions of human beings will cause us to be rewarded for our faith in the stock market in the long run.”
We may or may not see stagflation materialize in the quarters ahead. But the conditions worth watching are real, and the right response isn’t to react to every headline. It’s to stay diversified, keep your financial plan current, and make sure your allocation reflects your actual time horizon. If you have questions about how any of this applies to your situation, reach out to us to connect with a BIP Personal Wealth advisor.
This publication contains general investing information that is not suitable for everyone and is subject to change without notice. Past performance is no guarantee of future results and there is no guarantee that any views and opinions expressed will come to pass. Any reference to market or index performance is for informational and illustrative purposes only and does not reflect the deduction of fees and does not represent actual portfolios. The information contained herein should not be construed as personalized investment advice, tax advice, or financial planning advice, and should not be considered a solicitation to buy or sell any security. Investing in the stock market and the bond market involves gains and losses and may not be suitable for all investors. BIP Wealth, LLC is a registered investment adviser. Registration does not imply a certain level of skill or training. Additional information about BIP Wealth is available on the SEC’s website at www.adviserinfo.sec.gov.
Kevin Warsh Has an Almost Impossible Job. Here’s Why It Matters for Your Portfolio.
Kevin Warsh is about to become the next chair of the Federal Reserve, and I want to be honest with you: I don’t envy him one bit.
As chair, Warsh will lead the Federal Open Market Committee—12 voting members in total, made up of the seven Board of Governors, the president of the New York Fed (a permanent voter), and four regional Federal Reserve Bank presidents who rotate in on one-year terms.Together, they carry the weight of three congressional mandates:price stability, full employment, and keeping long-term interest rates at a moderate level(the oft forgotten third mandate from Congress since 1977).
That third one matters enormously right now. Compared to what he’s walking into, some of Kevin’s predecessors had it easy. Managing this economy in 2026 is a little like trying to nail Jello to a wall. Let’s all wish him the best of luck, for our sake.
This Isn’t Your Typical Inflation Story
Most of the time, the Fed keeps its eyes on consumer demand. When people spend too much, prices rise, and the Fed raises rates to cool things off. Simple enough in theory.
But what we’re dealing with now is a supply shock, and those are much harder to manage with interest rate policy. We saw this play out just a few years ago when pandemic-era supply chain breakdowns sent inflation spiraling. China’s zero-tolerance COVID policies contributed to a massive, policy-driven disruption that helped push the CPI-U (the Consumer Price Index for Urban Consumers) to a 9.1% annual rate in June 2022. At that point, the Fed had stayed committed to low short-term rates for far too long, and it became one of the bigger policy failures in recent memory.
Now, in early 2026, commodity prices are rising again across the board, with oil and refined products leading the way. The Producer Price Index climbed 1.4% in April, bringing its trailing twelve-month reading to 6.0% through April 2026. For context, the full-year 2022 PPI came in at 6.2%. We’re almost there. So the question a lot of people are asking, and that I’m taking seriously, is if we’re going to see retail inflation measures like the CPI-U jump to 9% again?
What BIP Did in 2022—and What We’re Doing Now
Source: This chart from BIP Wealth’s January 2023 Annual Market Report shows the Bloomberg U.S. Aggregate Bond Index’s historic decline in 2022.
When the last inflation surge hit, BIP Wealth was proactive in lowering the risks of rising rates in client portfolios. We pivoted much of our fixed income exposure to mimic the returns of the 3-month Treasury Bill Index rather than holding longer-duration bonds. The Bloomberg U.S. Aggregate Bond Index fell 13.01% in 2022, its worst annual performance ever. Our clients were protected from the brunt of that.
We are running the same play today. We’ve already reduced interest rate exposure in client portfolios, and we’re also taking profits from the equity run-up. Maybe the AI-driven boom can continue despite these macro headwinds, but we’re not counting on it.
The Fed’s Balance Sheet Problem
There’s another piece of this story worth mentioning: the Fed’s balance sheet.
Source: Federal Reserve Bank of St. Louis (FRED). The chart shows the balance sheet decline slowing in 2025 and now beginning to reverse upward.
In recent months, the Fed halted its so-called “quantitative tightening”—the gradual reduction of the massive bond portfolio it built up post-2008 and again post-pandemic. Not only did it stop selling, it has started buying Treasury bonds in the open market again. The effect of that is to suppress long-term interest rates, since the Fed is willing to accept whatever rate is offered. It also helps the U.S. Treasury to finance the annual budget deficit more cheaply at lower rates.
But here’s the catch: expanding the balance sheet means expanding the money supply. And more money chasing the same amount of goods leads to one thing: inflation! This is precisely why Warsh has stated publicly, for years, that he wants to shrink the Fed’s balance sheet. Whether he’ll actually be able to do that is the big question.
The Impossible Dilemma
So here’s where Kevin Warsh finds himself, and why this matters to you.
If he lowers short-term interest rates—which the White House favors, and which many believe he was selected partly to deliver—he risks pouring fuel on an inflationary fire that’s already burning hotter than most people realize. Warsh declared his independence during his Congressional confirmation hearings, but if he follows the path Powell took in 2021, we’ll likely see prices accelerate at the worst possible time.
If he shrinks the Fed’s balance sheet, as he has long advocated, be prepared for long-term interest rates to move meaningfully higher. The 30-year Treasury yield has already been flirting with 5% for weeks. A move toward 6% or higher would push mortgage rates up sharply, potentially crater the housing market, and significantly increase the cost of financing the national debt.
That debt is now nearly $40 trillion, larger than our entire annual GDP. Every percentage point increase in financing costs forces even more Treasury issuance to cover the interest, which compounds the problem further.
There’s no clean path here. He may have to choose between inflation and a credit crunch. That’s the Jello-on-the-wall problem.
Bottom Line
Kevin Warsh is walking into one of the more genuinely difficult jobs in recent Fed history. Supply shocks don’t respond neatly to rate policy. The balance sheet is expanding again. Commodity prices are climbing. And the political pressure to keep rates low is real.
At BIP Wealth, we’re not waiting to see how it plays out. We’ve already adjusted. Whether Warsh turns out to be the person who can nail Jello to a wall, we’ll find out soon enough.
If you want to talk through how your portfolio is positioned heading into this period of uncertainty, reach out to us to connect with a BIP Personal Wealth advisor.
This blog is provided for informational and educational purposes only and does not constitute investment advice or a recommendation to buy or sell any security. Investing involves risk, including the potential loss of principal. Past performance is not a guarantee of future results. Fixed income investments are subject to interest rate risk; bond values generally decline when interest rates rise. References to the Bloomberg U.S. Aggregate Bond Index and 3-Month Treasury Bill Index are for illustrative purposes only; indices are unmanaged and not available for direct investment.
The Consumer Price Index (CPI-U) and Producer Price Index (PPI) are published by the U.S. Bureau of Labor Statistics. Federal Reserve balance sheet data sourced from the Federal Reserve Bank of St. Louis (FRED).
Statements regarding BIP Wealth’s past portfolio positioning are historical in nature and are not indicative of future results or actions. BIP Wealth is a registered investment advisor with the U.S. Securities and Exchange Commission. Registration does not imply a certain level of skill or training.
Emerging markets and small caps are quietly stealing the show in 2026.
If someone asked you how the stock market has been doing so far in 2026, you’d probably mention that tech stocks had a rough first quarter—and that they’ve been bouncing back. That’s the story most people have been following. But here’s a number that might stop you in your tracks: emerging market stocks have outperformed the S&P 500 by roughly 9 percentage points year-to-date through April in 2026.
That’s not a rounding error. That’s a trend worth paying attention to.
So, Why Are Emerging Markets Outperforming the S&P 500 in 2026?
The real story of 2026—at least through the first few months—is an Emerging Markets and U.S. Small Cap rally. The MSCI Emerging Markets Index is up over 14% YTD, while the Russell 2500 (which captures all the U.S. stocks not in the S&P 500) is up over 13%. The S&P 500, by comparison, is up just under 6%.
The one-year numbers tell a similar story. Emerging markets are up nearly 48% over the past twelve months. The Russell 2500 is up 40%. The S&P 500? A solid 31%—but clearly not the top performer.
Index
1 Mo
3 Mo
YTD*
1-Year
100% Fixed Income
Bloomberg U.S. Aggregate (Total)
0.23
0.09
0.28
4.24
100% Global Equity
MSCI All Cap World Index IMI (Net)
10.12
3.70
7.09
31.62
Cash
S&P U.S. Treasury Bill 0-3 Mo (Total)
0.30
0.89
1.19
4.08
Municipal Bonds
Bloomberg Municipal 1-15 Bond (Total)
0.80
-0.53
0.53
5.98
Domestic Large Cap Equity
S&P 500 (Total)
10.49
4.19
5.70
31.05
Domestic Mid/Small Cap Equity
Russell 2500 (Total)
11.15
8.03
13.41
40.10
International Developed Market Equity
MSCI EAFE (Gross)
7.56
1.08
6.36
25.22
International Emerging Market Equity
MSCI Emerging Markets (Gross)
14.73
5.28
14.61
47.51
*As of 4.30.2026. For illustrative purposes only. Past performance is not indicative of future results. The indices referenced are unmanaged and cannot be invested in directly. International investing involves additional risks including currency fluctuations, political instability, and different accounting standards. Emerging markets involve heightened risks related to the same factors as well as increased volatility and lower trading volume. Small cap stocks may be subject to higher degrees of risk than large cap stocks. BIP Wealth, LLC is a registered investment adviser. Registration does not imply a certain level of skill or training. More information on these specific indices is included below.
Why This Matters—And Why It’s Not That Surprising
Those of us who’ve been doing this job for a while will remember when emerging markets and small caps were considered the most exciting corners of the stock market. That narrative faded during the long dominance of U.S. large cap growth stocks—particularly the mega-cap tech names that drove most of the S&P 500’s returns over the past decade.
But here’s the thing: valuation matters over time. Emerging market and small cap stocks are still significantly cheaper than U.S. large caps when measured by price-to-earnings ratios (P/E). That valuation gap is one reason there’s a rational case to be made that this trend has room to continue.
This doesn’t mean the S&P 500 is broken or that U.S. large caps are going away. It means that a well-diversified portfolio—one that includes exposure to international and smaller-company stocks—may look a lot smarter right now than it did a few years ago when U.S. large caps were winning everything.
What Does This Mean for Your Portfolio?
If your investments carry heavy U.S. large cap concentration—which, for many investors, is the default—this is a good moment to revisit your global diversification strategy. Not because the S&P 500 is doing poorly, but because other parts of the market are doing better, and for reasons that could persist.
At BIP Wealth, we build portfolios with global diversification in mind precisely because we don’t know which corner of the market will lead in any given year. This kind of year is a strong case for portfolio diversification beyond U.S. large caps and a good reminder of why that approach matters.
International diversification, small cap exposure, emerging market allocations—these aren’t “alternative” in the sense of exotic. They’re part of a thoughtful, long-term portfolio construction strategy.
A Trend Worth Taking Seriously
The biggest market story of 2026 isn’t the tech rebound. Emerging markets are outperforming the S&P 500 by nearly 9 percentage points year-to-date, and U.S. small cap stocks aren’t far behind. Cheaper price-to-earnings valuations and improving fundamentals suggest this may not just be a blip; and for investors with a well-diversified global portfolio, that’s meaningful.
If you’re curious how your current allocation stacks up, reach out to us to connect with a BIP Personal Wealth advisor.
The Bloomberg U.S. Aggregate Bond Index is a broad-based benchmark selected as the best available proxy for a high quality, diversified fixed income portfolio suitable for a U.S. investor. It is comprised of the Bloomberg U.S. Government/Credit Bond Index, the Mortgage-Backed Securities Indices, and the AssetBacked Securities Index. It is an unmanaged market value-weighted performance benchmark for investment-grade fixed-rate debt issues, with maturities of at least one year, and an outstanding par value of at least $100 million. The “Total Return” version of the index is reported here, which means that dividends are included and reinvested.
The MSCI ACWI IMI Index is a free float-adjusted market capitalization weighted global index selected as the best available proxy for a diversified stock portfolio consistent with modern portfolio theory. Approximately 60% of the index is comprised of the U.S. stock market and 40% is comprised of international stock markets, including both developed and emerging countries. The “Net Total Return” version of the index is reported here, which means the index reinvests dividends after the deduction of withholding taxes, using a tax rate applicable to non‐resident institutional investors who do not benefit from double taxation treaties.
The S&P U.S. Treasury Bill 0-3-Month Index is designed to measure the performance of U.S. Treasury bills maturing in 0 to 3 months.
The Bloomberg Municipal 1-15 Year Index is a broad-based benchmark that covers the U.S. dollar denominated long-term tax exempt bond market. The index has four main sectors: state and local general obligation bonds, insured bonds, and pre- refunded bonds. The “Total Return” version of the index is reported herein, which means that interest is included and reinvested.
The S&P 500 Index is a market capitalization weighted index that consists of 500 widely traded stocks chosen for market size, liquidity, and industry group representation. The “Total Return” version of the index is reported herein, which means that dividends are included and reinvested
The Russell 2500 Index is a free float-adjusted market capitalization weighted index intended to represent the smallest 2500 of the top 3000 U.S. companies. The “Total Return” version of the index is reported herein, which means that dividends are included and reinvested.
The MSCI EAFE Index is a free float-adjusted market capitalization weighted index that is designed to measure the equity market performance of international developed markets, excluding the U.S. and Canada. EAFE refers to Europe, Australasia, and the Far East and includes 21 individual countries that collectively represent many of the major markets of the world. The “Gross Return” version of the index is reported herein, which means that dividends are included and reinvested and there is no withholding tax applied to reduce returns.The MSCI Emerging Markets Index is a free float-adjusted market capitalization weighted index that is designed to measure the equity market performance of international emerging markets. It includes 21 individual countries that collectively represent many of the developing markets of the world. The “Gross Return” version of the index is reported herein, which means that dividends are included and reinvested and there is no withholding tax applied to reduce returns.
Copyright 2026 BIP Wealth. All rights reserved.
When most people hear “private credit,” their eyes glaze over somewhere between “senior secured” and “subordinated debt.” That’s understandable. The terminology sounds like it was designed to keep outsiders out. But the underlying concept is surprisingly intuitive once you see it laid out properly.
At its core, every private credit conversation comes down to one question: where does your money sit if something goes wrong?
That’s what the capital stack tells you.
What Is the Capital Stack in Private Credit?
The capital stack is the hierarchy of claims on a company’s assets and cash flows. It determines who gets paid first, and who absorbs losses first, when a borrower runs into trouble.
Think of it as a line at the bank. The people at the front of the line, senior secured lenders, get paid first, no matter what. The people at the back of the line, common equity holders, only get paid if there’s anything left after everyone ahead of them has been made whole. The further back you stand, the more you might earn for your patience, but the greater the chance you walk away empty-handed.
The layers near the top of the capital stack, working capital and senior secured debt, get repaid before anyone else. They’re typically backed by tangible assets: cash, receivables, equipment, real property. The layers near the bottom, preferred and common equity, absorb losses first and get repaid last.
Every layer exists for a reason, and every layer earns a different return that reflects the level of risk the investor is accepting. The relationship between position and risk isn’t complicated, but it may be one of the most important concepts in private credit investing.
How Do the Layers of Private Credit Risk Compare?
The interactive graphic below maps out the full capital stack alongside a company’s enterprise value: the assets that back these obligations. Take a moment to hover over each layer to see what it means and how it relates to risk and return.
The risk spectrum
Where a lender sits in the capital stack determines how much risk they take—and how much they earn. Hover over each layer to understand what it means for your investment.
Book Value
Remaining
Enterprise Value
Cash
Receivables
Inventory
Investments
PP&E
Trademarks / Patents
Remaining Value
Capital Stack
Working CapitalLowest Yield
Short-term funding for day-to-day operations like payroll and supplies. First to be repaid—lowest risk, lowest return.
Asset-Based DebtLow–Moderate
Loans backed by specific collateral like equipment, receivables, or inventory. If the borrower can’t pay, the lender takes the assets.
Senior Secured Debt ★BIP Focus
BIP Wealth’s primary focus. First in line to be repaid after working capital, backed by collateral. Think of it as standing at the front of the repayment line—everyone else waits behind you.
Subordinated DebtModerate–High
Repaid only after senior lenders get their money back. Higher yield compensates for the added risk of being lower in the stack.
Convertible DebtVariable
A hybrid: starts as debt but can convert to equity (ownership). Offers downside protection with upside potential if the company does well.
Preferred EquityHigher
Ownership with priority over common shareholders for dividends and liquidation. More risk than debt, but more predictable than common stock.
Common EquityHighest Risk
Last to be repaid if things go wrong—but gets all the upside if things go right. This is what you own when you buy stock in a company.
Risk
LowerHigher
BIP Wealth Primary Focus
Enterprise Assets
Capital Stack (risk increases ↓)
BIP Wealth’s approach: We focus on senior secured lending—the layer first in line to be repaid and backed by the company’s tangible assets. Think of it as standing at the front of the repayment line: if the borrower runs into trouble, senior secured lenders get paid before everyone behind them.
Here’s a quick summary of each layer, from lowest risk to highest:
Working Capital sits at the very top. These are short-term obligations that fund day-to-day operations like payroll, supplies, routine expenses. They’re repaid first and carry the lowest risk.
Asset-Based Lending involves loans secured by specific collateral like equipment, receivables, or inventory. If the borrower can’t pay, the lender has a direct claim on those assets.
Senior Secured Debt is backed by collateral and holds priority over all other long-term creditors. In a liquidation scenario, senior secured lenders are first in line to recover their capital from the company’s assets. This is where BIP Wealth concentrates its private credit strategies.
Subordinated Debt gets repaid only after senior lenders have been made whole. The higher yield on subordinated debt compensates investors for accepting that lower priority position.
Convertible Debt is a hybrid instrument that starts as a loan but includes the option to convert into equity under certain conditions. It offers some downside protection with participation in the company’s upside.
Preferred Equity represents ownership with priority over common shareholders for dividends and distributions. It carries more risk than any form of debt but offers more predictable income than common equity.
Common Equity is last in line for everything—distributions, liquidation proceeds, everything. Common shareholders bear the greatest risk but also have the greatest potential for return if the company performs well.
Why Does Senior Secured Direct Lending Attract So Much Attention?
Headlines tend to focus on the extremes. Equity investors making a fortune or losing everything generates clicks. But the most interesting part of the capital stack for many investors is the middle, specifically, senior secured direct lending.
Here’s why. Senior secured loans sit high enough in the stack that the borrower’s tangible assets serve as a meaningful safety net. If a company can’t make its payments, senior secured lenders have priority claim on those assets ahead of subordinated lenders, ahead of equity holders, ahead of everyone except the most short-term obligations at the very top.
At the same time, these loans may offer yields that meaningfully exceed what most traditional fixed income instruments have historically provided. That combination, repayment priority plus competitive income potential is what has drawn significant institutional capital to this space.
The tradeoff? Liquidity. Unlike a publicly traded stock you can sell on an exchange in seconds, private credit investments are typically held in evergreen fund structures with specific redemption windows and potential limitations on withdrawals. That reduced liquidity is actually part of the design which may help prevent the kind of forced selling that can destabilize public market strategies during periods of stress. However, investors should understand that their ability to access capital may be limited during certain periods.
How Does Knowing the Capital Stack Help You Evaluate Private Credit?
This is the part where the capital stack visual becomes genuinely useful as an educational tool. When someone says they “invest in private credit,” that phrase alone doesn’t tell you much. A subordinated debt fund and a senior secured direct lending fund are both technically private credit, but they occupy very different positions in the repayment line.
Subordinated debt may earn a higher coupon because the investor is accepting more risk—they’re further back in line if the borrower encounters difficulties. Convertible debt adds another dimension: it starts as a loan but can transform into ownership under certain conditions. Mezzanine financing sits in between, bridging the gap between debt and equity with characteristics of both.
Each of these strategies has a place in portfolio construction. But knowing which layer you’re investing in and understanding why it may pay what it pays can be the difference between a thoughtful allocation and a decision based on a label.
How Does BIP Wealth Approach Private Credit?
BIP Wealth’s private credit strategies concentrate on diversified, senior secured, direct lending backed by private equity sponsors. In practical terms, that means lending to established, middle-market companies where a large investment firm has performed due diligence, negotiated protective covenants, and has its own capital at stake alongside investors.
The objective isn’t to chase the highest available yield on the capital stack. It’s to target the layer where the historical risk-adjusted characteristics have been favorable, and where the structural protections provide a foundation for confidence across varying economic environments.
BIP Wealth complements this core approach with exposure to asset-based lending and, selectively, other strategies when they align with a client’s overall financial plan and risk tolerance.
The goal is never to maximize a single variable. It’s to construct a portfolio designed to seek consistent, reliable income without taking on more risk than the investor’s situation warrants.
Private credit strategies involve risks including the potential loss of principal, limited liquidity, and sensitivity to interest rate changes. Past performance of any strategy is not indicative of future results.
The Bottom Line
The capital stack isn’t just an academic framework, it may be the single most important factor in understanding what you actually own when you invest in private credit. Before evaluating any fund, any headline, or any investment opportunity, start with one question: where in the line am I standing?
If you understand that, everything else falls into place.
If you’d like to learn more about how private credit may fit within your overall portfolio, reach out to us to connect with a BIP Personal Wealth advisor.
This post is provided for informational purposes only and should not be construed as investment advice or a recommendation to buy or sell any securities. Ideas and opinions expressed represent the views of BIP Wealth and are subject to change without notice. Private credit investments involve risks, including the potential loss of principal. Privately traded offerings may only be available to investors who meet certain qualification statuses. There can be no assurance that actual outcomes will match any expected returns. Past performance is not a guarantee of future results. All investing involves risk, including the possible loss of principal. BIP Wealth is a registered investment advisor. Registration with the SEC does not imply a certain level of skill or training.
A summary of key insights from BIP Wealth Chief Investment Officer Eric Cramer’s recent webinar on the state of private credit and what it means for investors.
If you’ve been reading the financial news lately, you’ve probably seen some alarming headlines about private credit. Words like “crisis,” “redemptions,” and “growing concern” seem to be everywhere. However, the gap between what the financial media is reporting and what we’re actually seeing in the space has rarely been wider.
Here’s what you need to know.
What Is Private Credit, Anyway?
At its core, private credit is simply lending that doesn’t happen on a public exchange. It’s the original business of banking—you deposit money, and the bank makes loans with it. Any debt that isn’t publicly tradable qualifies as private credit, whether it’s a single loan or a bundle of them.
Think of it this way: if you’ve ever had a mortgage, a car loan, or a business line of credit, you’ve been on the borrowing side of private credit. The investment side just means you’re the one providing that capital and earning interest in return.
I like to tell people that one of the best ways to learn about private credit is to watch Mary Poppins. I’m serious. The film is set in 1910 England and the family’s last name Banks, which is no coincidence. There’s even a musical number about how the bank takes young Michael’s two pence and puts it to work making loans. That’s essentially a musical number about private credit.
And here’s the part I love: in the sequel, set decades later during the Great Depression, Michael’s money has stayed in the bank all that time. It’s grown enough to pay off his mortgage and rescue his family financially. It’s a memorable illustration of the potential value of a long-term investment horizon.
Why Today’s Headlines on Private Credit Are Misleading
Several recent news stories have painted a troubling picture of private credit, but a closer look suggests a more nuanced reality.
When Blackstone’s private credit fund saw increased redemption requests, management and ownership responded by putting their own money into the fund—a classic vote of confidence. The media, however, framed it as a crisis. When Cliffwater’s interval fund experienced higher-than-usual redemption requests, it wasn’t because the loans were in trouble, it was simply because Cliffwater is the easiest place for investors to access cash quickly. And when Blue Owl sold a $1.27 billion package of loans, they sold at exactly the price they were carrying those loans on their books—99.7 cents on the dollar—which actually validated the strength of their portfolio.
In each case, the underlying investments were performing well. The stories were about investor behavior, not investment quality.
It’s worth noting that on the institutional side, capital continues to flow into private credit. The headline-driven anxiety has been largely concentrated among retail investors.
Where the Real Pressure Is Coming From
So why are some retail investors looking for cash in the first place? The answer lies mostly outside of the private credit space.
Tech stocks experienced significant sell-offs in early 2025 and again in Q1 2026. The S&P 500 IT sector was down over 9% in the first quarter of 2026 alone. Meanwhile, crypto has been hit even harder, falling roughly 50% from its highs. Many of those investors were highly leveraged, meaning they had borrowed money to invest. When their bets went south, they needed to find cash somewhere, and private credit was one of the safest, most stable places they had money sitting.
In other words, the redemption activity in private credit isn’t a sign that private credit is broken. It’s a sign that other parts of the market are under stress, and investors are tapping their most reliable accounts to cover losses elsewhere.
Not All BDCs Are Created Equal
Part of what may be fueling confusion is a misunderstanding about a term you may have seen: BDC, or Business Development Corporation. There are publicly traded BDCs, the kind you can buy and sell every minute in a brokerage account, just like a stock, and then there are privately traded BDCs, which is the type BIP Wealth utilizes in some client portfolios.
The publicly traded versions tend to be more speculative in nature, often carry higher fees (in many cases 5–6% per year), and a number of them trade at significant discounts to their net asset value. In the first quarter of 2026 alone, some of these publicly traded BDCs experienced losses of 25–30%. It’s possible that many of the journalists writing alarming private credit headlines are looking at these publicly traded BDC vehicles—which are not part of BIP Wealth’s current private credit strategy—and conflating them with the broader private credit market.
The “SaaSpocalypse:” Real Threat or SaaSquatch?
One of the buzzwords making the rounds is “SaaSpocalypse”—the idea that artificial intelligence will wipe out the Software-as-a-Service industry. Since many private credit loans are made to software companies, this has raised some eyebrows.
The reality is more complex. Yes, AI will change the software landscape over time. Some SaaS companies may lose customers who can replicate certain functions using AI tools. But many SaaS companies are themselves becoming AI-enabled, and any major disruption will take years, not months, to play out.
More importantly, if you’re worried about SaaS companies struggling, the equity investors (the people who own stock in those companies) stand to lose far more than the lenders. Private credit investors sit higher in what’s known as the “capital stack,” meaning they get paid before equity holders. If a company’s value declines, the stockholders absorb the losses first.
Understanding Your Position: The Capital Stack
Knowing your position in the capital stack is perhaps the most important concept for private credit investors to understand. When you invest in private credit through BIP Wealth, you’re primarily in “senior secured” loans. That means your claim on a company’s assets is near the top of the priority list, ahead of subordinated debt, convertible notes, preferred equity, and common stock.
When I reference a stock like Microsoft dropping a certain percentage, I’m showing you what happened to the common equity, which is at the bottom of the capital stack, where the greatest risk of loss typically resides. Senior secured lenders sit near the top. If a company runs into trouble, senior secured debt holders are generally among the first to be repaid. The equity investors—the ones whose stock prices you see on CNBC—bear the greatest risk. And in many cases, those private equity investors will actually inject more capital into a struggling company to keep it healthy, which makes the senior secured loans even safer.
What Are Evergreen Funds, and Why Do They Matter?
BIP Wealth primarily uses “evergreen” private credit strategies. Unlike older models that required periodic capital calls and had unpredictable timelines, evergreen funds work on a “fund and done” basis. You invest when you’re ready, you earn income along the way, and there are regular opportunities to withdraw.
This structure is becoming the new standard across the industry. In 2025 alone, nearly 80 new evergreen funds launched. Institutions like university endowments and insurance companies are adopting them too, not just individual investors. It’s a more accessible, more transparent, and often lower-fee way to participate in private credit.
The strategies many of you are familiar with, including those managed by firms like LAGO, Monroe, KKR, Barings, and Cliffwater, are the types we’ve evaluated through our due diligence process and offer to clients. Each may serve a slightly different role in a diversified private credit allocation, depending on an investor’s individual circumstances.
Redemption “Gates” Are a Feature, Not a Flaw
You may hear that certain funds are “gating” redemptions, meaning they’re limiting how much investors can withdraw in a given quarter. This sounds alarming, but it’s actually a protective feature, similar to an early withdrawal penalty on a bank CD.
These funds are designed to honor a set percentage of redemption requests each quarter (typically 5–7.5%). If requests exceed that threshold, everyone receives a proportional share. The reason is simple: managers don’t want to sell loans at a discount just because some investors are in a rush. That would hurt the long-term investors who are staying put.
Most of the underlying loans in these portfolios mature in three to four years. If a fund simply stopped making new investments and let everything run its course, it would all convert to cash naturally. There’s no fundamental liquidity problem, just a temporary mismatch between redemption requests and the pace at which loans mature.
What Should You Expect Going Forward?
Continued communication from BIP Wealth. The BIP investment team monitors these markets daily, reads hundreds of articles, and is in constant contact with fund managers. As long as private credit remains in the news, clients can expect regular updates.
More headlines about redemptions, non-accruals, and PIK rates. Non-accruals (borrowers temporarily not making interest payments) and PIK rates (pay-in-kind, where you receive additional principal instead of cash interest) are normal features of lending. For the strategies BIP Wealth recommends, these metrics remain stable and healthy.
Some minor pricing adjustments. As credit spreads widen—meaning new loans are being made at slightly higher rates—existing loans may be marked down slightly to reflect the new market rate. This doesn’t mean the loan is in trouble; it’s simply a bookkeeping adjustment. And the good news is that new investments going into these funds will earn those higher rates, which benefits long-term investors.
Higher yields ahead. The same market dynamics causing short-term noise are actually creating better opportunities. Funds that were projected to yield 9% may now deliver 10% or more, as lenders can command better terms from borrowers.
Possible gating of redemptions. As I explained above, this is a structural feature designed to protect shareholders from forced selling at unfavorable prices. We view it as a prudent risk management tool, not a warning sign.
The Bottom Line
Private credit, particularly the senior secured, diversified, evergreen strategies that BIP Wealth recommends, remains one of the most stable and attractive corners of the investment landscape. The headlines are driven by a combination of media sensationalism, stress in unrelated markets like tech stocks and crypto, and a fundamental misunderstanding of how private lending works.
I’ll leave you with this: Michael Banks left his two pence in the bank, and in the story, it made all the difference. By the time the sequel rolled around decades later, that small investment had grown enough to pay off his mortgage. While fiction isn’t a substitute for financial analysis, the principle of maintaining a long-term perspective, particularly during periods of short-term volatility, has historically served investors well. The investors who stay the course tend to come out ahead.
If you have questions about your own private credit holdings or want to discuss your portfolio, reach out to us to connect with a BIP Personal Wealth Advisor. They’re engaged in this analysis on a regular basis and are ready to discuss the choices that may be right for your individual circumstances and risk tolerance.
Want to Explore Private Credit Yourself? Start Here Using AI.
One of the best ways to build confidence in any investment is to understand it on your own terms. For those who want to dig further into private credit, here are a few prompts you can use with AI tools like ChatGPT or Claude to explore the data behind the strategies we use at BIP Wealth:
“Within private credit, which strategies have demonstrated the lowest default and loss rates over time?”
“What structural protections exist in senior secured loans that are not present in other forms of private credit?”
“How does private equity sponsorship affect recovery rates in direct lending?”
“What have been the historical loss rates for senior secured direct lending funds through economic cycles?”
“What are typical covenant packages in sponsor-backed senior secured private credit deals?”
“How do loan-to-value ratios in private credit investments compare to broadly syndicated loans?”
“How does covenant enforcement impact loss severity in direct lending?”
And here’s a bonus tip: Once you get an answer, ask, “What would be some other good questions for me to ask about private credit?” It will generate a whole new set of prompts to keep learning from. Just be mindful—it’s easy to spend an afternoon going down that rabbit hole.
This blog post is a summary of a recent BIP Wealth client webinar and is intended for informational purposes only. This post should not be construed as investment advice, nor a recommendation or solicitation to buy or sell any security. Ideas contained within this post regarding the market or market conditions represent the views of the author or the sources cited and are subject to change without notice.
All investing involves risk, including the possible loss of principal. Private credit investments involve additional risks, including illiquidity, limited transparency, credit risk, interest rate risk, and the potential for restrictions on withdrawals. Past performance is not indicative of future results. There can be no assurance that actual outcomes will match any expectations described in this post.
Investors cannot invest directly in an index. Index performance does not reflect fees, expenses, or transaction costs associated with the management of an actual portfolio. Data from third-party sources (Morningstar, PitchBook, Standard and Poor’s, MSCI) is believed to be reliable but BIP Wealth cannot guarantee accuracy. Forward-looking statements, estimates, and forecasts are based on assumptions and are not guarantees of future performance.
Investors should consult with their Personal Wealth Advisor to determine what is appropriate for their individual circumstances and risk tolerance. BIP Wealth, LLC (“BIP Wealth”) is registered with the U.S. Securities and Exchange Commission (“SEC”). Registration with the SEC and other state securities authorities as a registered investment adviser does not imply a certain level of skill or training.
Copyright 2026 BIP Wealth. All rights reserved.
As we shared during our 2026 Annual Market Report presentations, we expected the Federal Reserve to hold steady on interest rates for the foreseeable future. That view was firmly reinforced following the Fed’s meeting on Wednesday, March 18th, where futures market pricing left little doubt: the current overnight rate is likely here to stay.
The futures market—where investors express their convictions with dollars rather than words—currently points to the Fed maintaining the existing Federal Funds Rate all the way through the April 28th, 2027 meeting. This rate directly influences money market yields and margin borrowing costs, making it a meaningful benchmark for investors across the board.
That said, the picture isn’t entirely static. While a prolonged pause appears most likely, there remains a meaningful and asymmetrical probability that rates could move lower before the end of 2026. Specifically, futures pricing reflects a measurable chance of cuts of 25 or even 50 basis points by year end, while the probability of a rate increase is, by contrast, nearly zero. The Fed’s “dot plot,” which captures where individual members see rates heading, doesn’t yet reflect a clear consensus, but it does leave the door open to a cut later this year.
One of the key variables to watch will be energy prices. History shows a strong correlation between oil price movements and future inflation, and with ongoing volatility in the region as the situation in Iran continues to develop, energy markets will remain an important signal. We believe futures pricing is among the best real-time tools available for tracking how these dynamics are evolving and we will continue monitoring them closely on your behalf.
As always, we’ll keep you informed as the landscape shifts. For those who want to explore the data directly, the CME FedWatch Tool offers an up-to-date view of rate expectations as priced by the market.
This post is provided for informational purposes only. Specific investments may not be suitable for all investors and no offer or recommendation of any investment or investing strategy is intended or implied by your choosing to read this post. This material is not intended to be relied upon as a forecast or investment advice regarding a particular investment or the markets in general, nor is it intended to predict or depict the performance of any investment. The third-party information in this post is from sources we believe to be reliable, but BIP Wealth cannot guarantee its accuracy.
Welcome to our 2026 Annual Market Report with Eric Cramer, CFP®, CFA®, BIP Wealth’s Chief Investment Officer. For this year’s presentation, Eric starts with an honest scorecard of how BIP’s 2025 investment themes played out, recaps what happened in markets around the globe, and makes the case for why the economic landscape is shifting in ways that matter for your portfolio.
In case you missed the live presentation, we’ve summarized Eric’s main talking points below. You can also watch the recording of the presentation below.
Grading Our 2025 Investment Themes
Eric opened by going back to the four key investment themes BIP Wealth identified for 2025 and gave an honest accounting of how each played out.
Theme 1: Brace for a Tech/Crypto Crash
Eric acknowledged this one made BIP Wealth CEO Bill Harris a little bit nervous when he used the word crash—but Eric’s reasoning was sound. A lot of tech and crypto exposure was leveraged, and as we saw during the housing crisis, leverage in any direction can be a real problem.
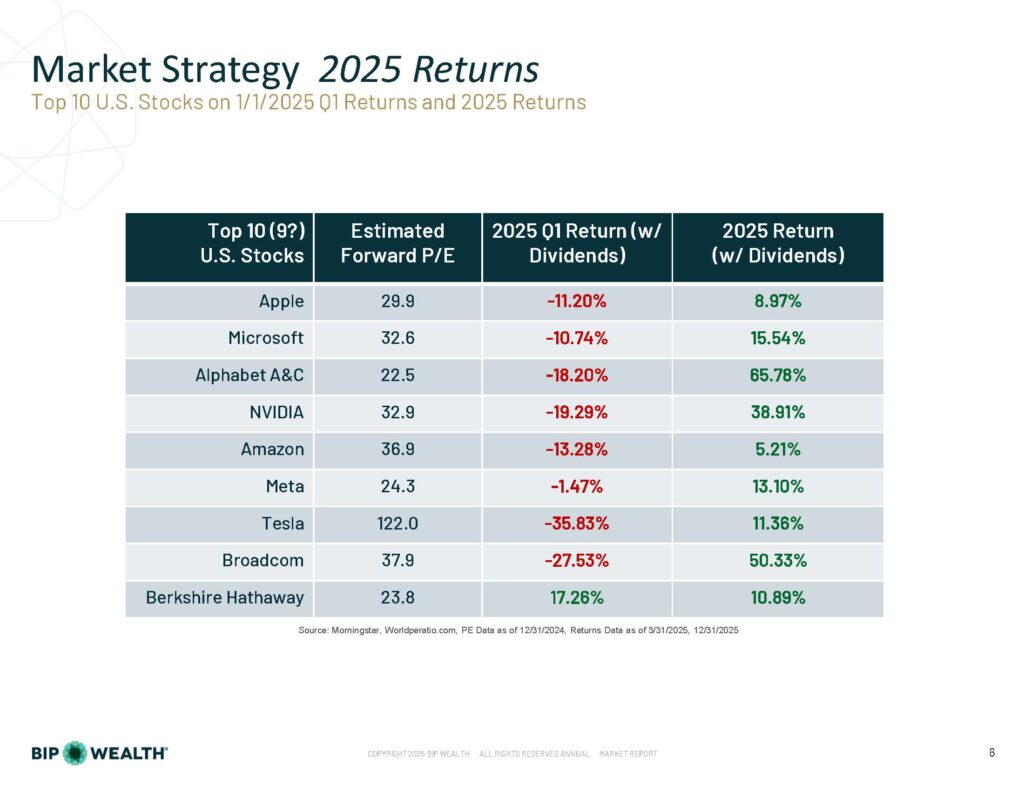
By the end of Q1, it looked like Eric was going to be right—and he admitted he honestly was not excited about that. Tech stocks got hit hard in the first quarter. Tesla fell 35.83%. NVIDIA fell 19.29%. But then something remarkable happened: markets turned the corner and several of those same stocks came roaring back. Alphabet, for example, went from down 18% in Q1 to up more than 65% for the full year. Berkshire Hathaway flipped the other direction, shining in Q1 when tech was falling, then giving some of that back over the remaining three quarters.
The ultimate verdict? “We kinda got close to a crash,” Eric said, “but crash is probably too strong a word.” It was a significant downturn followed by a remarkable recovery.
Source: Morningstar, Worldperatio.com, PE Data as of 12/31/2024, Returns Data as of 3/31/2025, 12/31/2025
Theme 2: It’s Time to Diversify
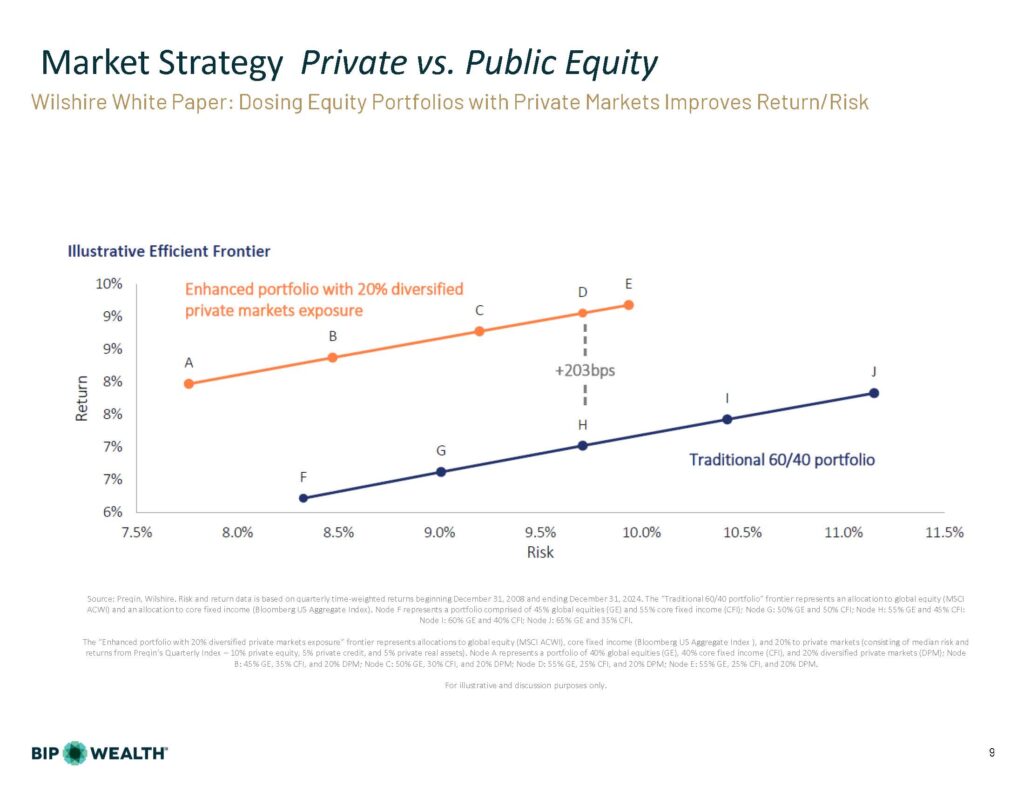
The public stock market’s top 10 stocks represented about a third of the entire market’s value at the start of 2025—and even a little more by the end. While most investment managers typically think of diversification in terms of the public markets, Eric made the case for private markets as the most meaningful diversification tool available.
On the private equity side, Eric shared compelling data: over longer periods, private equity has delivered returns roughly four percent higher per year than public equity. And crucially, the two asset classes don’t move in lockstep—which means holding both yields lowers volatility than holding either one alone, as the markets are not directly correlated.
He also highlighted a significant change in how investors can access private markets. The traditional model—committing to a fund, experiencing years of capital calls, then waiting another decade for your money back—is giving way to a new breed of vehicles called Evergreen Funds, including BDCs and interval funds. These allow you to put money in when you want and request liquidity in advance of when you need it. Eric called this a game changer for us and for you and noted that the newest versions have little to no paperwork.
Source: Preqin, Wilshire. Risk and return data is based on quarterly time-weighted returns beginning December 31, 2008 and ending December 31, 2024. The “Traditional 60/40 portfolio” frontier represents an allocation to global equity (MSCI ACWI) and an allocation to core fixed income (Bloomberg US Aggregate Index). Node F represents a portfolio comprised of 45% global equities (GE) and 55% core fixed income (CFI); Node G: 50% GE and 50% CFI; Node H: 55% GE and 45% CFI: Node I: 60% GE and 40% CFI; Node J: 65% GE and 35% CFI.
The “Enhanced portfolio with 20% diversified private markets exposure” frontier represents allocations to global equity (MSCI ACWI), core fixed income (Bloomberg US Aggregate Index ), and 20% to private markets (consisting of median risk and returns from Preqin’s Quarterly Index – 10% private equity, 5% private credit, and 5% private real assets). Node A represents a portfolio of 40% global equities (GE), 40% core fixed income (CFI), and 20% diversified private markets (DPM); Node B: 45% GE, 35% CFI, and 20% DPM; Node C: 50% GE, 30% CFI, and 20% DPM; Node D: 55% GE, 25% CFI, and 20% DPM; Node E: 55% GE, 25% CFI, and 20% DPM. For illustrative and discussion purposes only.
Theme 3: Financial Planning is Critical
Eric noted he was pleased to see that many BIP Wealth clients got their financial plans updated in 2025. This remains a core part of the BIP approach: there are often risks that can be identified and mitigated with the right plan in place. No further commentary needed — just a strong endorsement to keep your plan current.
Theme 4: Safer Assets Can Be Productive
The era of earning inflation-beating returns on the safest possible assets has narrowed significantly. Short-term treasuries are currently yielding around 3.6%, and Eric doesn’t expect the Federal Reserve to lower rates for much of, or possibly all of 2026. They held at the last meeting, and the futures market puts any cut likely at mid-year at the earliest. He noted there’s even a scenario where rates could move higher.
For clients in high tax brackets holding treasuries in taxable accounts, the margin over inflation has become thin. That’s led BIP to look more closely at municipal bond strategies, which Eric described as increasingly attractive. Because so many states have balanced budget requirements, he went as far as suggesting that munis may be the new treasuries in terms of safety.
The Market Recap: Let’s Get Out the Globe
The Year That Felt Like Surgery Without Anesthesia
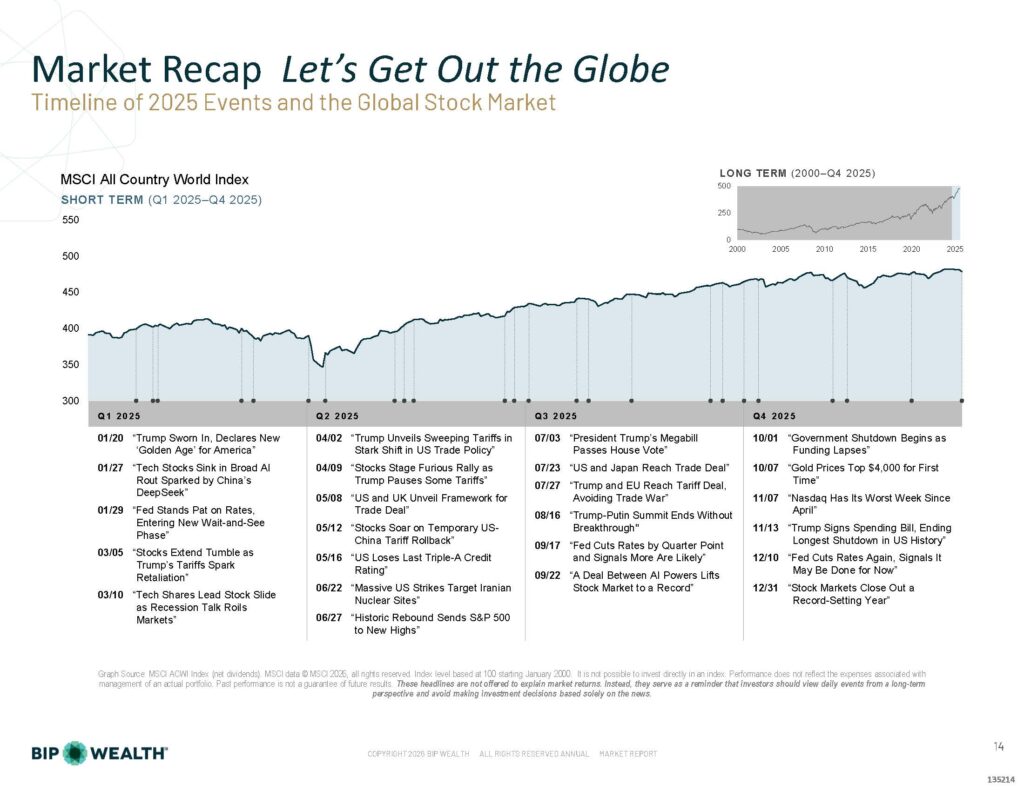
Someone told Eric that 2025 felt “a bit like surgery without anesthesia.” The year was packed with headlines: tariff announcements, geopolitical moves, government shutdowns, market swings. But if you missed the news and just looked at the value of your investment accounts, you might have blinked and missed the fact that there was even a downturn. Markets dipped on tariff news early in the year and came right back. This is the third consecutive year of a strong global stock market, and Eric noted that for many clients, their own balance sheets are about as big as they’ve ever been.
Even though the U.S. stock market had a terrific year—returning 17.15%—the best returns in 2025 came from outside the country. International developed market stocks returned 31.85% for the year. Emerging market stocks returned 33.57%, nearly double what the U.S. produced.
A big part of the story is the weakening U.S. dollar. When the dollar weakens, foreign currencies strengthen. And when you invest in overseas equity markets, you’re really investing in both a foreign stock market and a foreign currency. When both go up together, you get the compounded effect of those two phenomena. That’s how you get these impressive international numbers.
It’s worth noting, however, that a weaker dollar cuts both ways. It can help U.S. manufacturers whose goods become cheaper overseas, but it makes imported goods more expensive for the rest of us. More dollars to buy the same goods: that’s the definition of inflation.
The Market Outlook: Revaluing Debt and Currencies
Eric warned this section would feel a little bit like an econ class, but the material is important, and he walked through it in a way that’s worth unpacking.
Japan and the Carry Trade: A Crisis in the Making?
One of the more fascinating and underappreciated dynamics affecting global markets right now is what’s happening in Japan. For decades, Japan had ultra-low or even negative interest rates. Home safes became popular in Japan because at least your money didn’t shrink sitting in a safe. But in a negative rate environment, sophisticated financial players could borrow in Japanese yen for next to nothing, invest in U.S. Treasuries at 4%, and pocket a comfortable margin. This was the Japanese carry trade, and it reached into the trillions of dollars across decades.
That trade has more or less evaporated. Japan’s interest rates have skyrocketed, borrowing costs are far higher, and the margin that made the trade profitable is gone. This is a real problem and it’s one reason why the U.S. could see pressure to intervene in currency markets, which would further weaken an already weakened dollar.
Consumer Confidence: A Tale of Two Americas
The consumer confidence data tells a nuanced story. The “present situation” index is holding up better than the “expectations” index—both trending downward, but the present looks better than the future. Eric noted he often encounters this disconnect in conversations with clients: “I’ll ask them how they’re doing, and they may talk about pessimism about the economy. But when we get down to how they’re doing personally, they’re often doing great.”
Part of what explains that gap is who drives consumer spending. The top 20% of earners are responsible for about half of all consumer spending in the U.S.
Here’s a concept worth sitting with: Eric learned in business school that the stock market reflects the state of the economy. But he thinks that may have flipped. Today, if the stock market is doing well and your balance sheet is at record highs, you feel good about spending—and the economy follows. The tail is wagging the dog.
For those in the top tier of earners and asset holders, this dynamic is likely to persist. If there’s a problem with interest rates and the Fed has to come to the rescue printing money, if you’ve got an investment portfolio, you’re probably going to be fine.
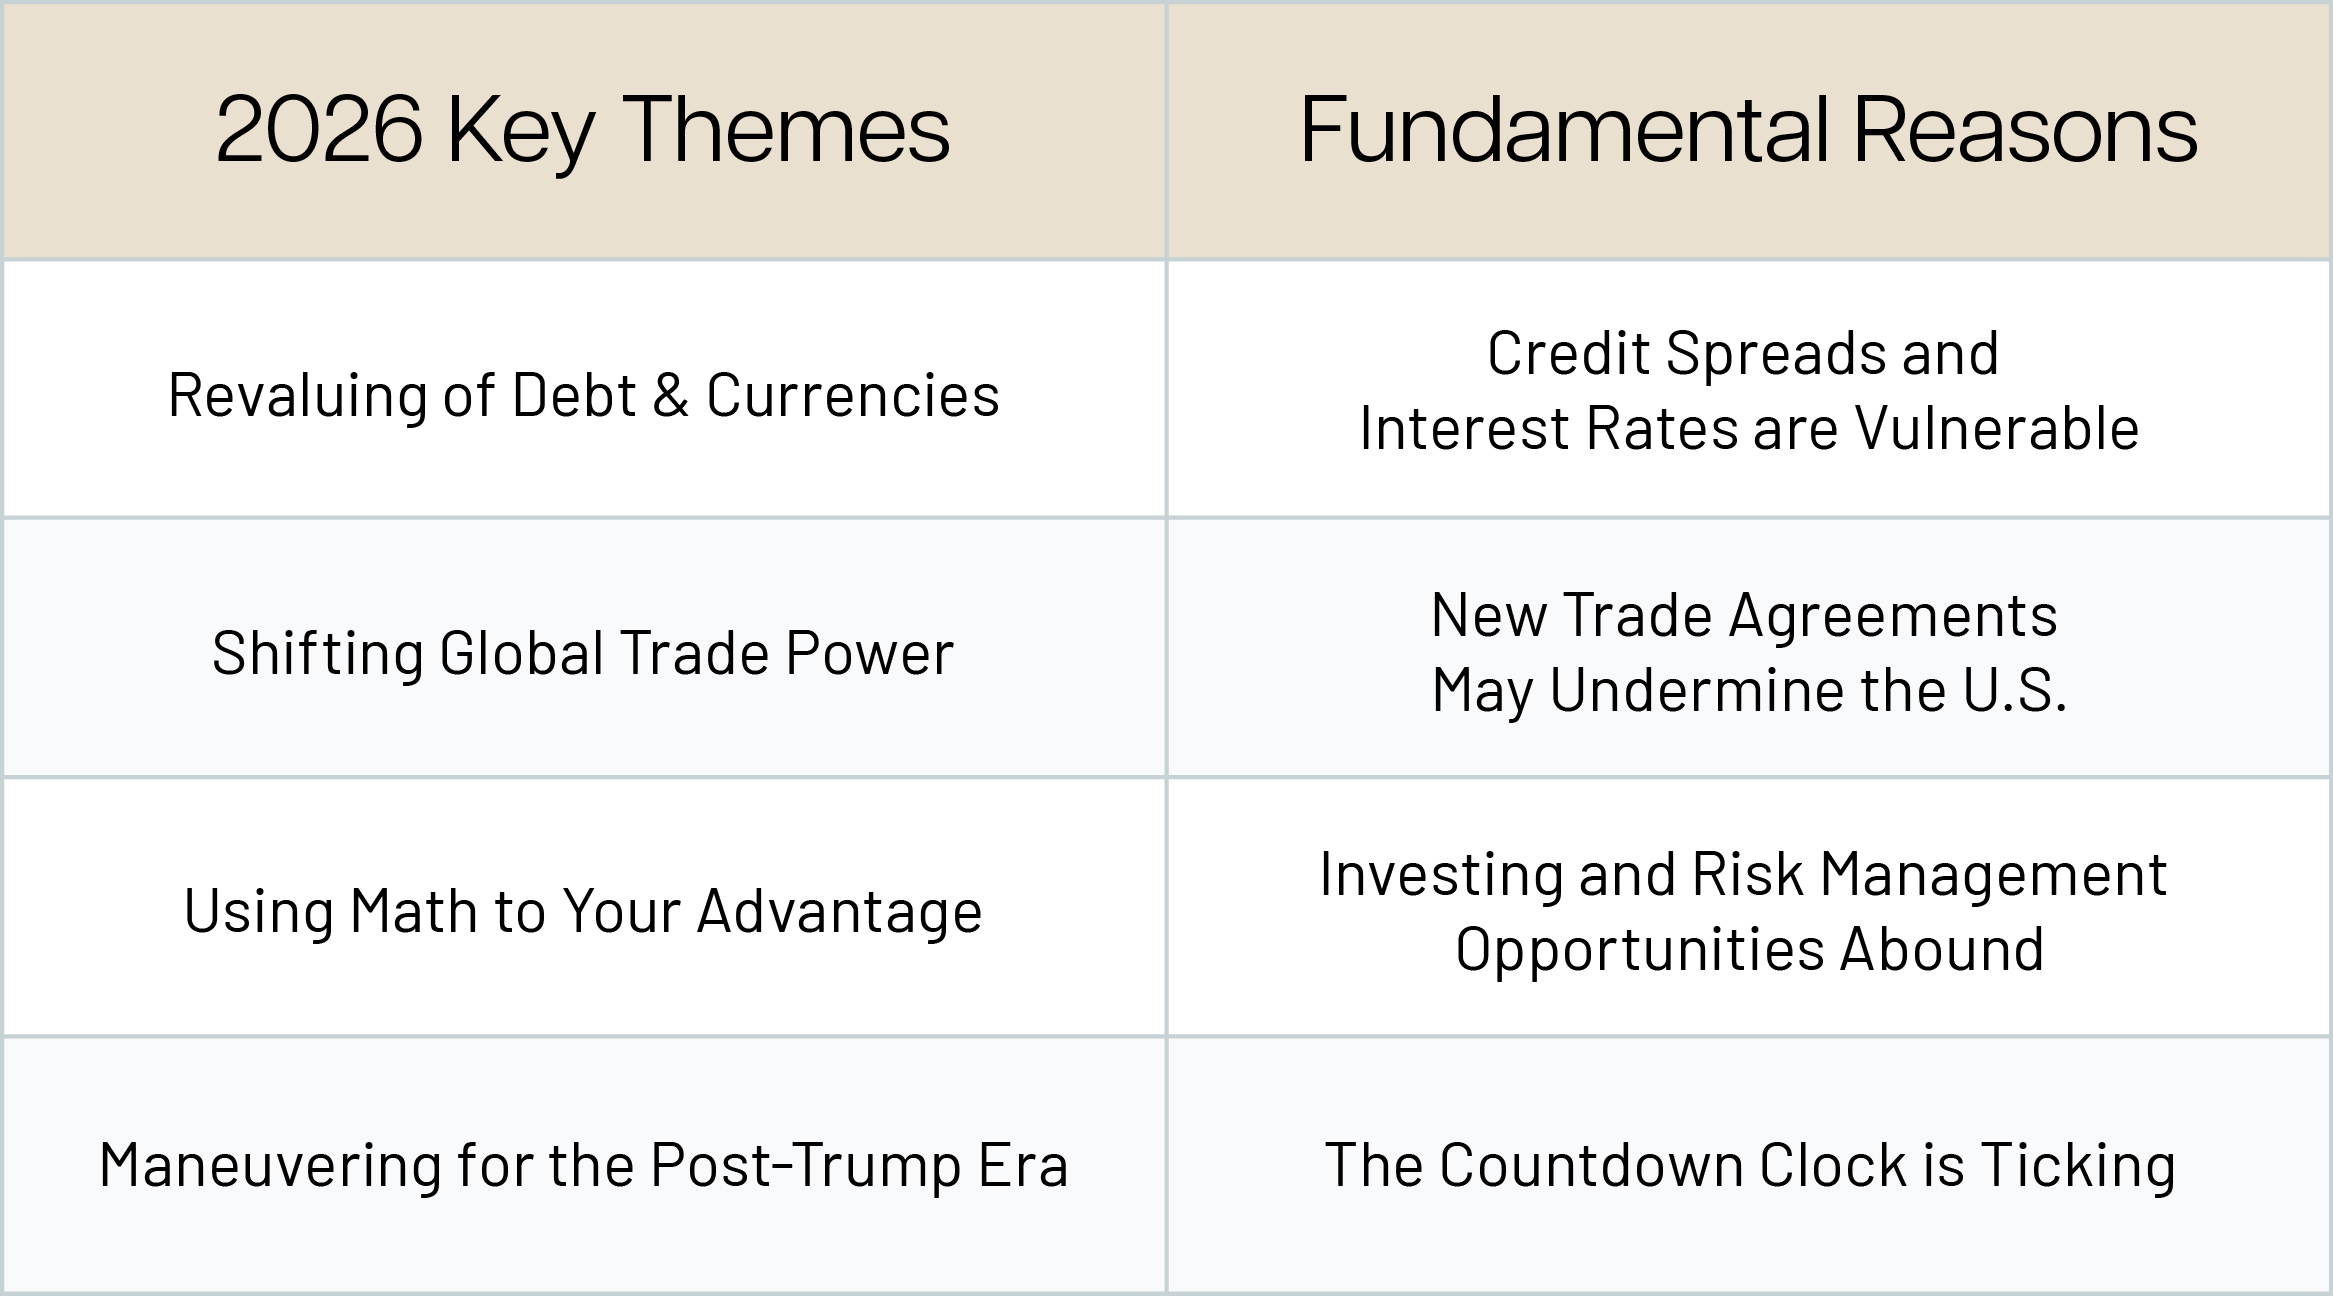
Our 2026 Key Investment Themes
Looking ahead, BIP Wealth has identified four themes that will shape our investment approach this year:
Revaluing of Debt & Currencies: Credit spreads and interest rates are vulnerable.
Shifting Global Trade Power: New trade agreements are being written around the globe that may increasingly leave out the United States. This has real implications for the dollar’s global dominance, and it’s something Eric intends to watch closely and update clients on throughout the year.
Using Math to Your Advantage: Throughout 2026, BIP will share specific “nuggets of math” that could improve your return, lower your risk, or improve your overall financial situation.
Maneuvering for the Post-Trump Era: The countdown clock is already ticking, and both political parties are maneuvering now. The 2026 midterm elections are going to be a very big deal, with potentially significant effects on tax rates, monetary policy, and fiscal policy.
Final Thoughts from Eric Cramer, CFP®, CFA®
Eric closed with a broader perspective on the moment we’re in. The world is changing fast—AI, global trade, geopolitics—and that’s changing the landscape for investing in ways that require expertise and attention to evidence rather than headlines.
America is divided, economically as much as politically. The bottom half of Americans don’t own a share of stock. The top earners hold most of the assets and drive most of the spending. For BIP Wealth clients, that divide is actually somewhat protective, but it also creates instability that we need to plan around.
“BIP Wealth is dedicated to using the best evidence available to help you meet your financial goals in a future that doesn’t look like the past,” Eric said. “This is when expertise and insight matter most.”
Don’t be surprised if your Personal Wealth Advisor brings new ideas to your next conversation. BIP Wealth is actively building and deploying new tools to help clients navigate everything this year may bring. If you’d like to speak with an advisor about your portfolio or learn more about how our 2026 themes might affect your financial plan, we’d love to hear from you.
This communication contains general investing information that is not suitable for everyone and is subject to change without notice. Past performance is no guarantee of future results and there is no guarantee that any views and opinions expressed will come to pass. The information contained herein should not be construed as personalized investment advice, tax advice, or financial planning advice, and should not be considered a solicitation to buy or sell any security. Investing in the stock market and the bond market involves gains and losses and may not be suitable for all investors. Indices are not available for direct investment. Certain private market investments are subject to qualification thresholds and are subject to significant risks, including liquidity risk.
Private Credit is a large and growing category in the private market investing landscape. With exits harder to come by lately, more companies are adding debt to their capital structure (for several reasons that include avoiding direct dilution of equity). The dramatic increase in importance of private credit to the funding of companies has also led to a proliferation of funding vehicles that investors might participate in. New managers are popping up almost daily, and new vehicle types are emerging too. Co-investments, drawdown funds, public BDCs, private BDCs, and now Interval Funds are all seeing growth. These vehicles are making it easier for retail investors to include private credit in their portfolios.
In the broader credit markets, several trends are unfolding that could have a negative impact on some parts of Private Credit.
First, base rates are falling. The Fed has now lowered the overnight rate, as it should, to remove us from a restrictive stance. Many private credit strategies use floating rate loans, so falling rates will naturally lower yields. Investors should keep in mind that their return is a combination of the yield and the always changing price. Minor fluctuations in price are normal, and investors can expect yields to be lower in 2026 than they were in 2025. The long end of the yield curve is falling too, as the Fed ends quantitative tightening (no longer dumping bonds on the market to decrease its balance sheet, which was draining liquidity out of the system). We are also near a multi-year low point for credit spreads, reflecting that investors are getting paid less to take credit risk.
The combination of new money coming into Private Credit, along with a changing rate structure and price for credit risk, will certainly influence Private Credit in the larger sense. But the devil is in the details, and broad pronouncements that read something like “private credit is in trouble” are not accurate, not helpful, and outright confusing to our clients.
At BIP, we believed this would eventually happen, and we welcome the market pressure. It’s our chance to prove we know what we’re doing. This is the perfect time to show how real knowledge is so much more valuable than just knowing the headlines. Our clients are counting on us at BIP Wealth to get this right. And we have already done our homework to make sure we have a variety of evergreen strategies that we expect to do well in a variety of economic conditions.
Here are several important ideas you should know:
1. Recent headlines about private credit BDCs getting into trouble are referring to publicly traded BDCs and not the privately traded BDCs that BIP Wealth presents to our clients.
Business Development Companies are entities that meet certain regulatory requirements created in 1980 and are close-end funds that distribute 90% of income. We track about 3 dozen publicly traded BDCs, and 2025 returns through 12/31/25 range from +16.75% to -27.38%, with more in negative territory than positive. This is markedly different from the returns we are seeing in the vehicles we’re using, and you may notice that few survived the pullback in credit markets during 2022 unscathed.
Original data from Morningstar as of 12/31/2025
2. These publicly traded BDCs that we don’t own often trade in BSLs (Broadly Syndicated Loans), which BIP’s strategies almost completely avoid.
BSLs tend to be of lower quality and lack the covenants and remedies that are the hallmark of our strategies. BSLs are originated by banks, securitized, and then traded daily. Some might equate this to juggling chainsaws when credit markets turn sour—you want to drop them as quickly as you can to avoid getting your hand cut off.
3. The privately traded BDCs that BIP uses have several commonalities:
Our strategies invest almost entirely in Senior Secured Loans. Not subordinated debt, not mezzanine debt, not BSLs. Instead, their lending is usually at the top of the capital stack on the balance sheet of the borrowers. In other words, the borrowers must pay our loans first, above almost all other obligations.
Our strategies are lending a large proportion of their funds to borrowers who are also supported by private equity funds. These private equity managers give an equity cushion that can often be expanded during times of financial stress (through loan covenants) to increase the safety of the loans when needed. Covenants may compel the PE sponsors to add more cash to the balance sheet or take other measures to protect the security of the loans.
Our strategies are mostly floating rate loans. This provides a consistent cushion of 500-600 bps above the returns of low-risk public market fixed income alternatives. In the current environment, rates are falling, which lowers lending returns but also lowers the cost of leverage experienced by these strategies, avoiding a rate mis-match problem that banks have been dealing with forever (and not very successfully in 2022 when banks invested in long-term low rate Treasurys while having to pay out high rates to their depositors)!
Our strategies were selected for their market discipline and are not chasing returns by deviating from their target market. Some target smaller companies and some target larger companies, but there is no evidence of our strategies having to corrupt their mandates to invest money, or of them accepting inadequate terms from borrowers.
The manufacturers we have chosen usually originate the deals they invest in, or are a part of a small group that originates the deals. This is very different from the BSL market. This allows them to have a deep understanding of each borrower’s risk profile and business strategy.
Leverage is limited. BDCs can borrow money to amplify returns, which is generally good for investors. But in the range of what is allowed (borrowing $2 for every $1 of investor equity), ours are pretty tame. This allowable amount of leverage is double what was allowed until 2018, but only the riskier strategies that we have not chosen are that leveraged. Interval funds are only allowed $.5 of leverage, so the new interval fund choices are even less exposed to the math of leverage if prices were to fall.
Most of our BDCs are highly diversified, owning hundreds of loans with very small exposure to even their largest positions. This diversification is often a key way to control risk to the investor.
4. We also invest in individual deals, or “co-investments.”
These are, by nature, not diversified. But here again, the details are important. Many are convertible notes, which in reality are equity deals that pay a yield to the investor and sit above other equity investments in terms of their priority. We have a long history of enjoying some of our best equity returns from these investments.
5. By offering several carefully selected managers that are working at what we believe is the safer end of the private credit markets, we are in the enviable position of being able to stand back and watch what happens to the rest of the market if things turn sour.
We expect to be able to prove to our clients that your trust in us is warranted. But this comes with the obligation to explain our prudent process in a world of scary headlines. If the risky end of the private credit market does start to experience significant stress, some of our clients may become concerned.
If you would like to learn more about our Private Credit strategies and if they might be a fit for you, the BIP Wealth team is here to help. Contact us today to be connected with a trusted advisor.
This post is provided for informational purposes only. Specific investments may not be suitable for all investors and no offer or recommendation of any investment or investing strategy is intended or implied by your choosing to read this post. Privately traded offerings may only be available to investors who meet certain qualification statuses.
This material is not intended to be relied upon as a forecast or investment advice regarding a particular investment or the markets in general, nor is it intended to predict or depict the performance of any investment. Past performance is no guarantee of future results. All investments involve risks including loss of principal.